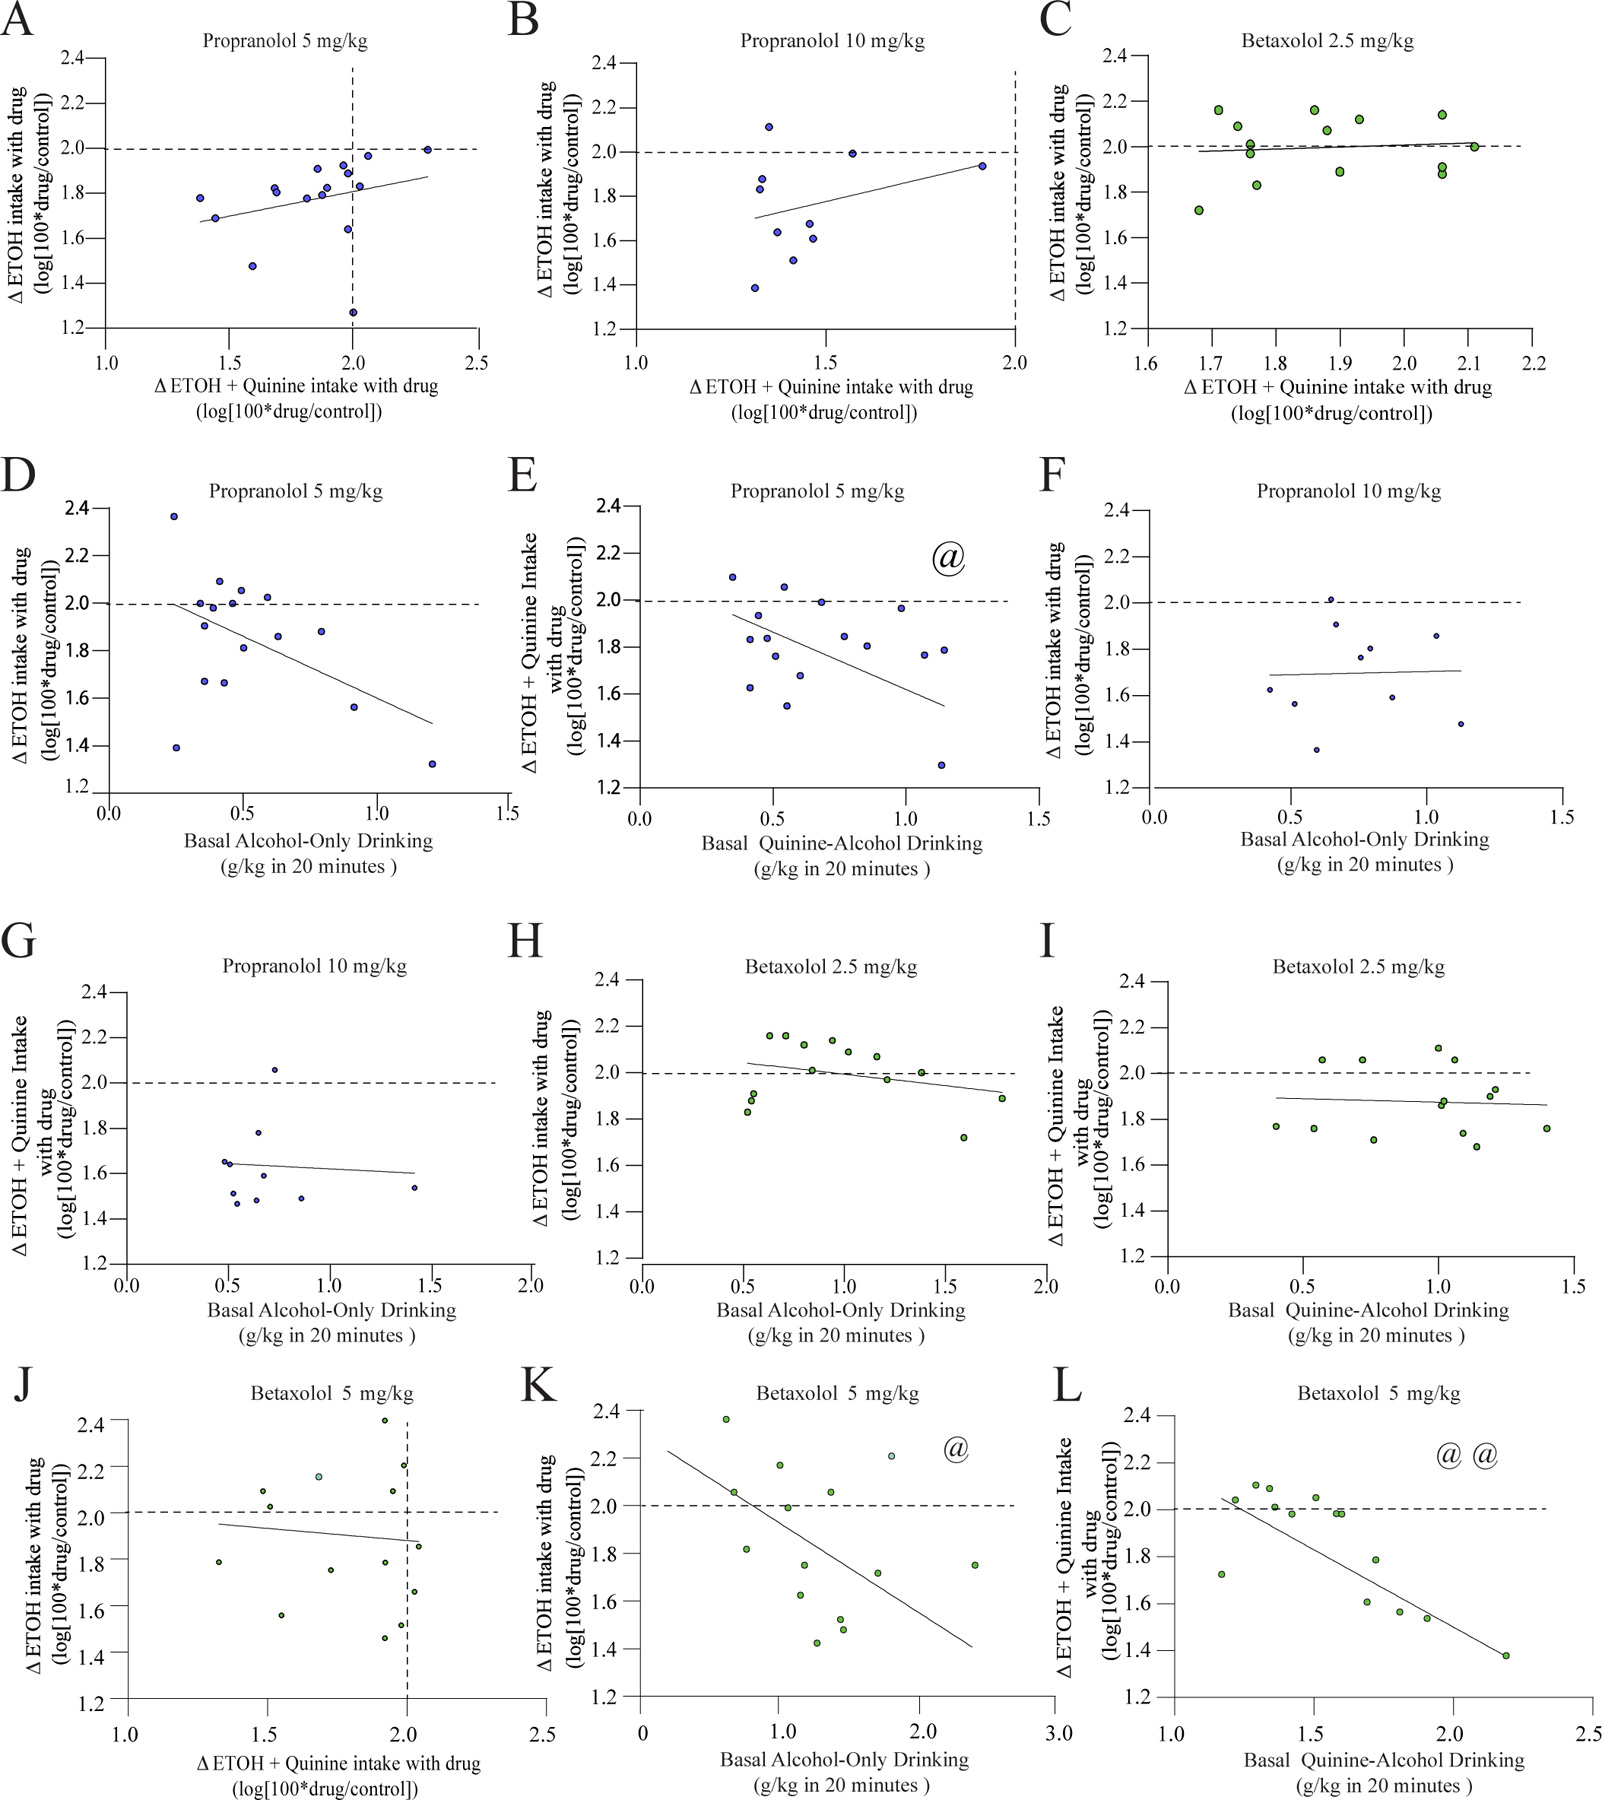
Figure 2. Correlations related to propranolol and betaxolol effects on drinking.

(A-C) Drug-related changes in AOD and changes in CLAD were not correlated for 5 mg/kg propranolol (A), 10 mg/kg propranolol (B), or 2.5 mg/kg betaxolol (C). (D,E) Relation between changes in drinking with 5 mg/kg propranolol (y-axis) and basal intake levels (x-axis) for AOD (D) and CLAD (E). (F,G) Relation between change in drinking with 10 mg/kg propranolol and basal intake levels for AOD (F) and CLAD (G). (H,I) Relation between change in drinking with 2.5 mg/kg betaxolol and basal intake levels for AOD (H) and CLAD (I). (J) Drug-related changes in AOD and changes in CLAD were not correlated for 5 mg/kg betaxolol. (K,L) Relation between change in drinking with 5 mg/kg betaxolol and basal intake levels for AOD (K) and CLAD (L). A dashed line indicates where drug intake was not different from vehicle, and values below the dashed line indicate that alcohol drinking under drug exposure was reduced relative to vehicle treatment. @, @@ p<0.05, p<0.01 correlation.
