
Figure 2.
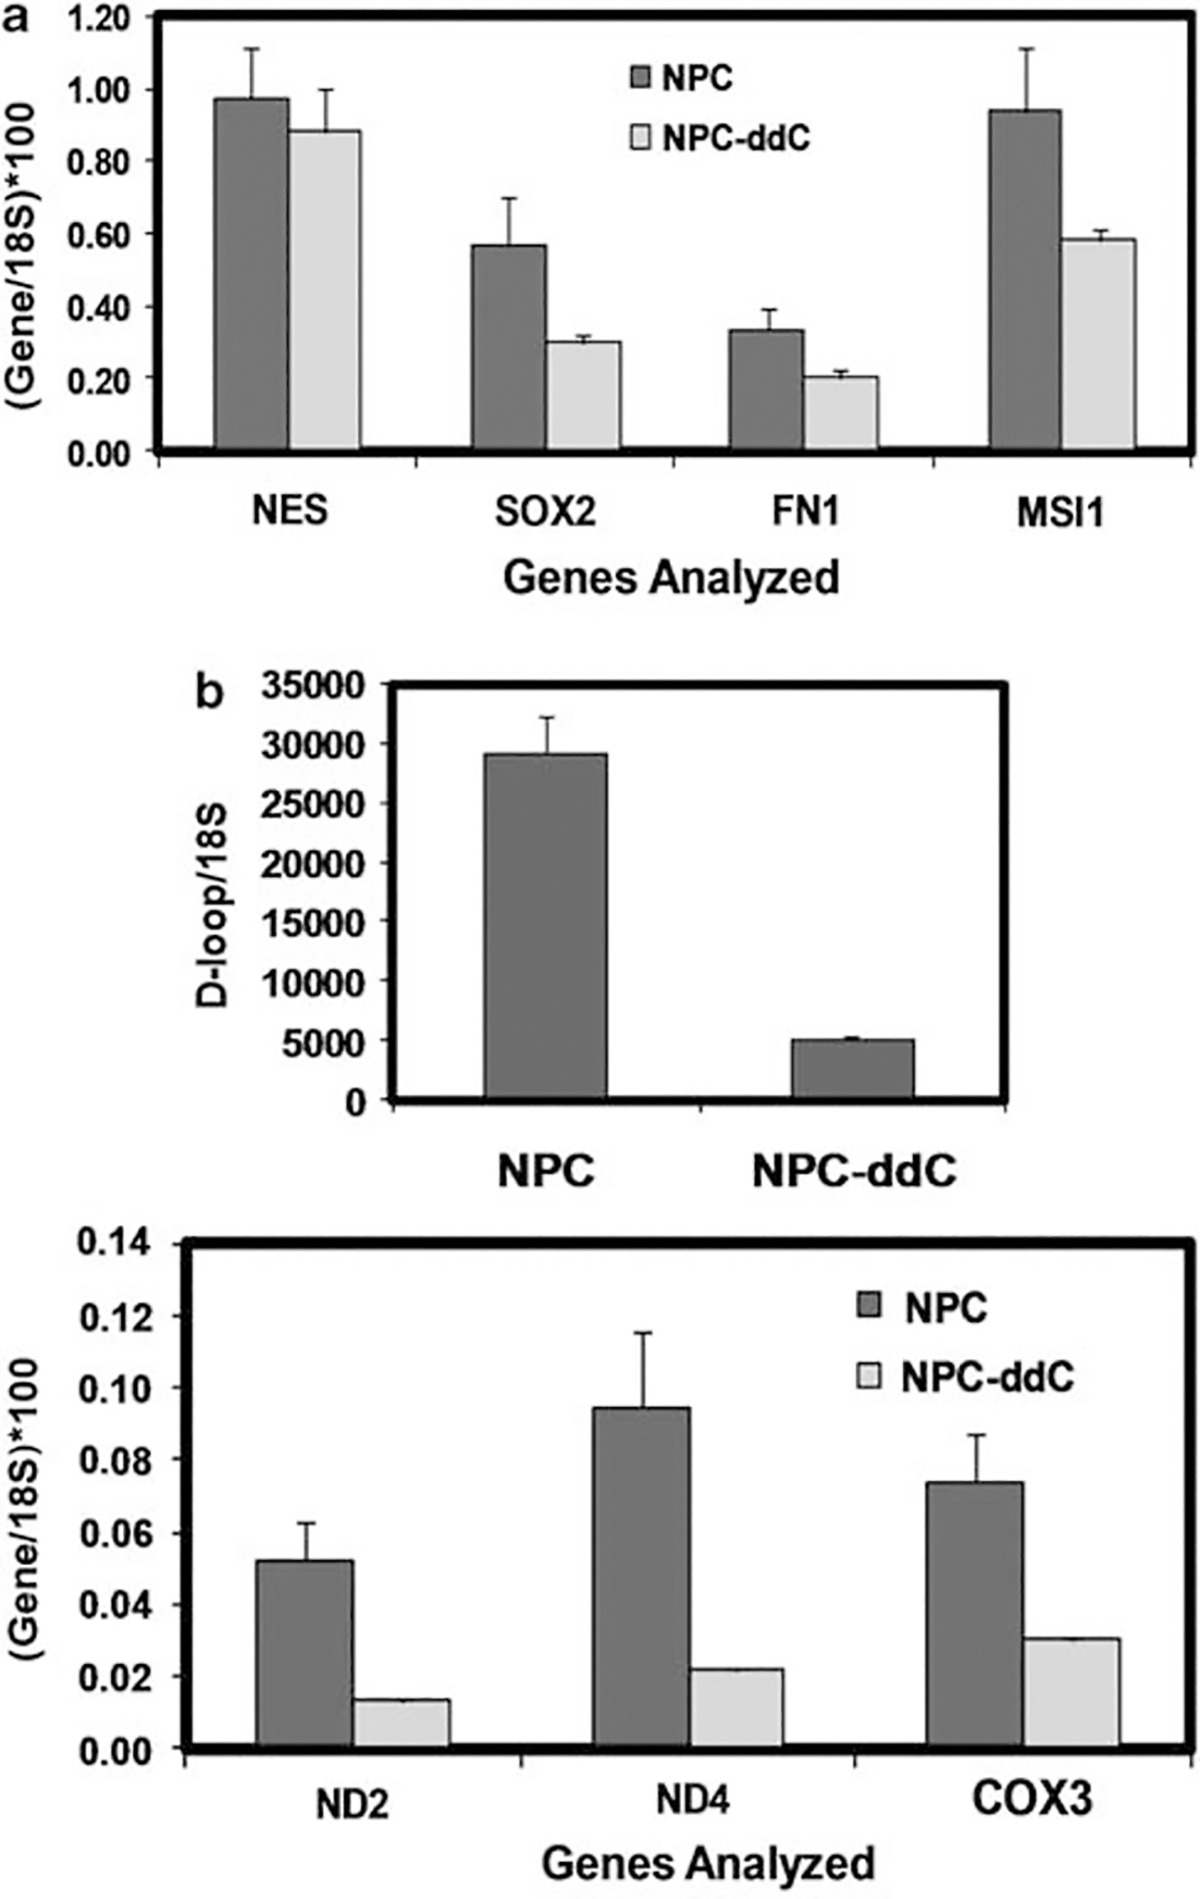
(a) Quantitative real-time PCR analysis of candidate neural progenitor markers indicates no significant change in gene expression upon ddC treatment of hNPs. RNA was reverse transcribed to cDNA, and assayed using qPCR and multiplex TaqMan probes for NESTIN (NES), SOX2, FIBRONECTIN1 (FN1) and MUSASHI1 (MSI1). Shown are 18S rRNA-normalized mean +/− s.e.m. copy numbers for NPC (normal hNP) and NPC-ddC (hNPs treated with 10 μm ddC for 6 days). One-way analysis of variance showed P>0.05 for each gene comparison. (b) Quantitative real-time PCR analysis of candidate mitochondrial markers indicates significant change in gene expression upon ddC treatment of hNPs. Extracted genomic DNA was analyzed for mtDNA copy number using qPCR and primers that amplified portions of the D-loop, ND2, ND4 and COX3 genes. Shown are 18S rRNA-normalized mean +/− s.e.m. mtcDNA copy numbers for NPC (normal hNP) and NPC-ddC (hNPs treated with 10 μm ddC for 6 days). One-way analysis of variance showed P<0.05 for D-loop and each gene comparison.