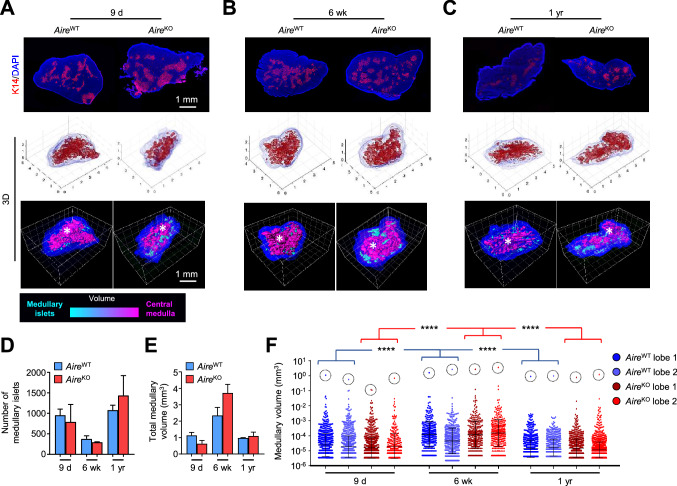
Fig. 1.
The medullary topology is dynamic throughout life, independently of Aire expression. A–C Representative images of thymic sections stained for keratin 14 (red) and counterstained with DAPI (blue) (upper panel). For3D reconstruction of thymic lobes from 9-day- (A), 6-week- (B) and 1-year-old (C) AireWT and AireKO mice, using Matlab (middle panel) and Imaris to depict medullary regions according to their volumes from cyan (smallest) to magenta (largest) (lower panel). Axes are graduated in millimeters (mm). Scale bar, 1 mm. The asterisk denotes the central medulla. D,E Histograms show the number of medullary islets (D) and the total medullary volume (E) derived from two thymic lobes for each condition. F The graph shows the volumes of each medullary islet derived from two thymic lobes for each condition from individual mice measured by For3D. The dashed circle denotes the central medulla of each lobe. Horizontal lines represent the geometric mean and SD. ****p < 0.0001 using Kruskal–Wallis test for (F)

