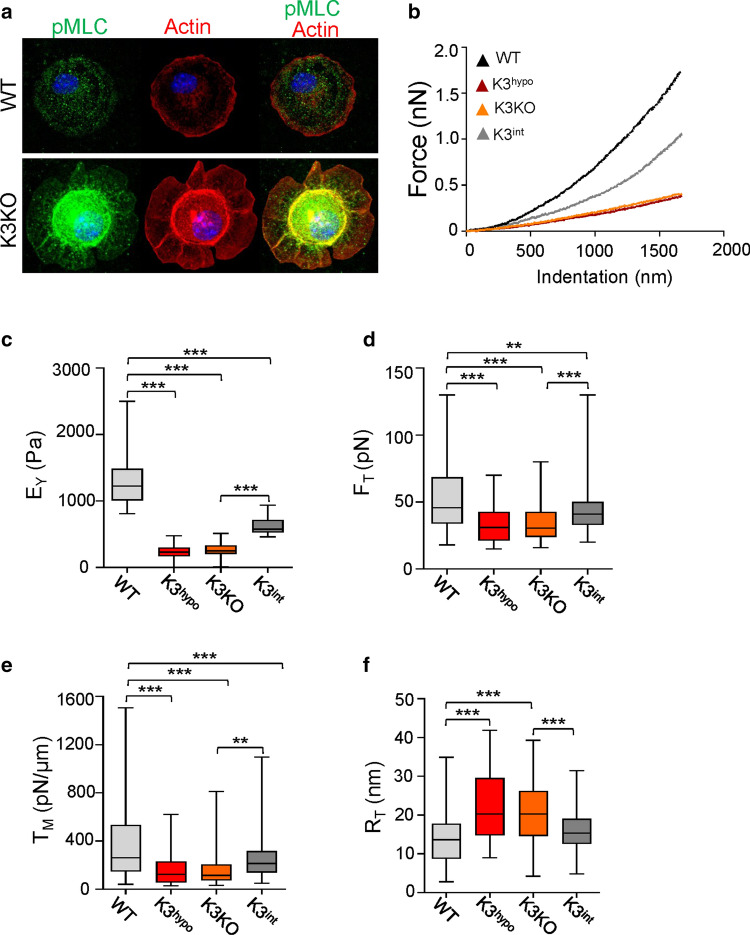
Fig. 1.
K3 deficiency diminishes microglia plasma membrane tension. a Representative confocal images of WT, and K3KO primary microglia in their initial stages of spreading on fibronectin in vitro. The cells were stained with pMLC (green) and phallodin for actin (red). The K3KO cells show significant levels of pMLC and actin localized to the cell center instead of the cell membrane as compared to WT. b Representative force-indentation curves showing significantly less resistance to indentation in K3-deficient cells. c Cell stiffness represented as Young’s modulus (EY, Pa) for WT, K3hypo, K3KO, and K3int cells. n = 68 (WT), 69 (K3hypo), 69 (K3KO) and 45 (K3int) for the analyzed force-indentation curves. d Membrane tether forces (FT) of primary microglia measured by retraction of the AFM tip from the cell surface (i.e., tether). e The apparent plasma membrane tension of K3hypo, K3KO, and K3int microglia is significantly lowered compared to WT. f The K3hypo and K3KO cells have greater tether radius compared to WT and were obtained using , where KB is the bending modulus. n = 106 (WT), 109 (K3hypo), 93 (K3KO) and 119 (K3int) for the analyzed membrane tether forces, plasma membrane tension, and tether radius. All box and whisker plots show median (line within box), upper and lower quartiles (bounds of box), and minimum and maximum values (bars) analyzed by one-way ANOVA with Tukey’s post hoc; **p < 0.01, ***p < 0.001

