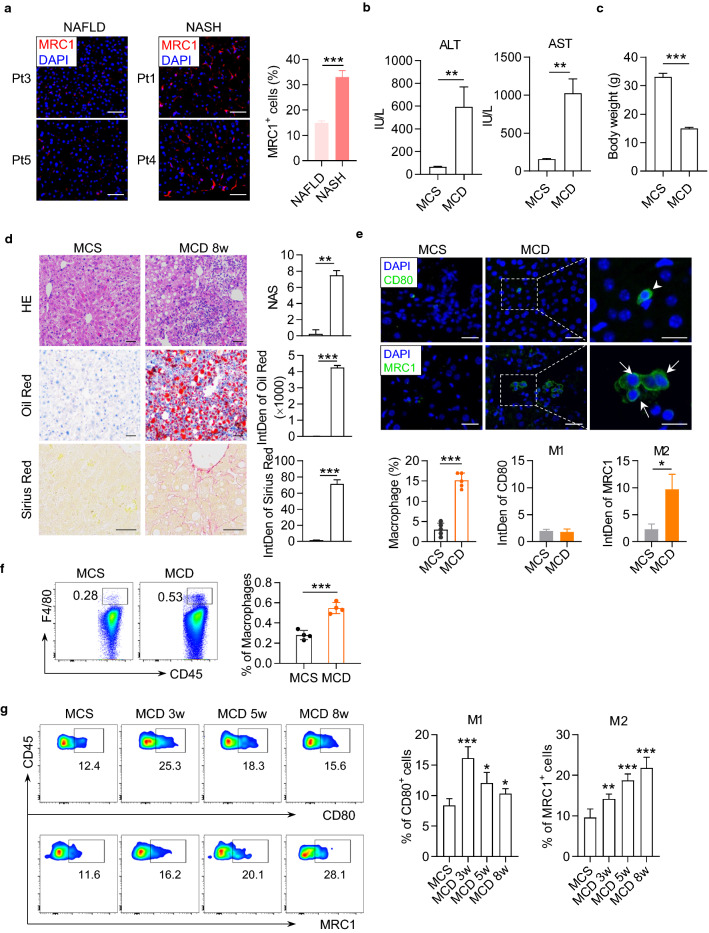
Fig. 1.
Liver macrophages polarized toward M2 phenotype during the progression of fibrosis in MCD-fed mice and human patients with NASH. a Immunofluorescence pictures of MRC1 (red) and DAPI (blue) staining in the liver of human patients with nonalcoholic steatosis or NASH. Integrated density of MRC1 signals in the staining pictures were quantified and compared between groups. Scale bar = 100 μm. b Serum concentrations of ALT and AST in the mice fed with MCS or MCD diet for 8 weeks. c The body weight of mice. d Representative histopathologic staining pictures of hematoxylin and eosin (HE), Oil red and Sirius red in the liver of mice. NAFLD Activity Score (NAS) was calculated according to the performance of HE staining. Integrated density of positive staining signals was quantified with ImageJ software and compared between groups. HE and Oil red staining picture, scale bar = 25 μm. Sirius red staining picture, scale bar = 100 μm. e Representative immunofluorescence pictures of CD80 (green) and DAPI (blue) staining in the upper panels, or MCR1 (green) and DAPI (blue) staining in the lower panels in the liver of mice. Mice fed with MCS or MCD diet for 8 weeks. Integrated density of positive signals in the staining pictures were quantified and compared between groups. Original photo, scale bar = 20 μm; Zoomed photo, scale bar = 100 μm. f Gating strategy for mouse liver macrophages by flow cytometry. Macrophages were gated as CD45+7aad−F4/80+. g Representative dot plots displaying the expression of CD80 (upper) and MRC1 (lower) gated on CD45+F4/80+ macrophages from liver of mice. Percentage of CD80+ (M1 phenotype) and MRC1+ (M2 phenotype) cells in macrophages. Data represent mean ± standard deviation (SD) (n = 4 in each group). P-values were obtained by unpaired t test (two groups) or one-way ANOVA (multiple groups). *P < 0.05, **P < 0.01 and ***P < 0.001 compared with MCS group

