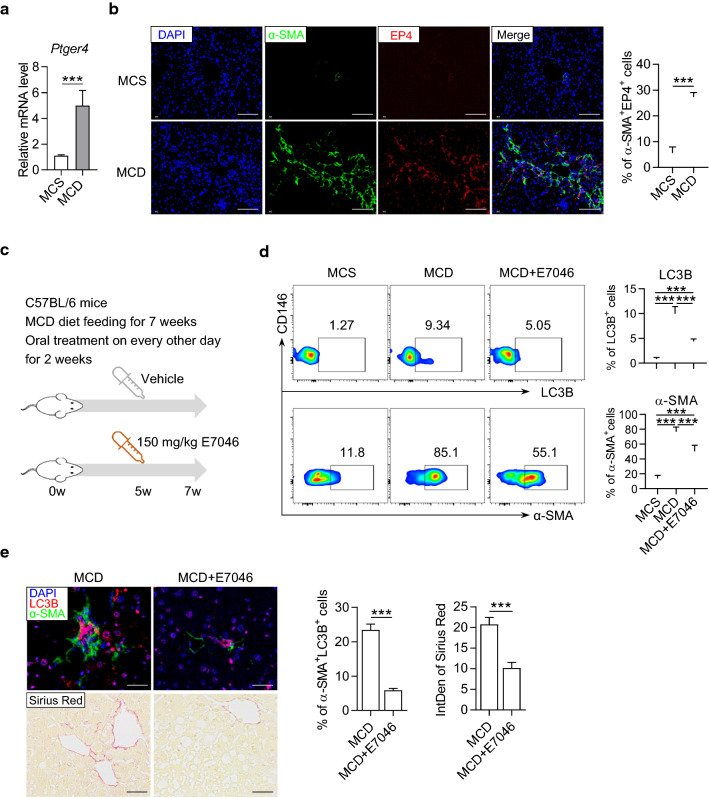
Fig. 7.
The autophagy of HSCs and liver fibrosis was improved by in vivo blockade of EP4 with E7046. a The expression of EP4 coding gene Ptger4 in the liver of MCD mice. The mice were fed with MCD diet for 8 weeks and the liver homogenate was subjected to real-time PCR assay. b Representative immunofluorescence staining pictures of α-SMA (green), EP4 (red) and DAPI (blue) in the liver of mice feeding with MCS or MCD diet for 8 w. Integrated density of positive signals and the percentage of α-SMA+EP4+ cells in the staining pictures were quantified and compared between groups. Scale bar = 100 μm. c Schematic diagram of E7046 treatment to MCD mice. d Representative dot plots displaying the expression of LC3B (upper) and α-SMA (lower) gated on CD45−CD146−UVAF+ HSCs in the liver of mice. Percentage of LC3B+ and α-SMA+ cells were calculated and compared between groups. Data in bar graphs represent mean ± SD (n = 5 in each group). e The upper pictures are representative immunofluorescence staining of α-SMA (green), LC3B (red) and DAPI (blue) in the liver of mice. Scale bar = 100 μm. The lower pictures are representative Sirius red staining in the liver of mice. Scale bar = 200 μm. The percentage of α-SMA+LC3B+ cells and the integrated density of Sirius red in the staining pictures were quantified and compared between groups. P-values were obtained by unpaired t test (two groups) or one-way ANOVA (multiple groups). ***P < 0.001 between indicated groups

