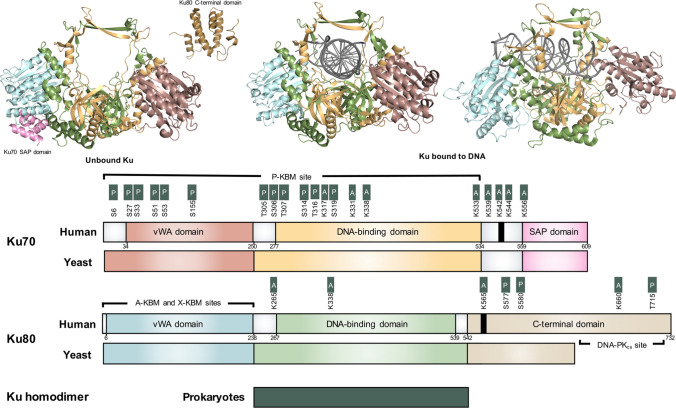
Fig. 2.
Ribbon diagram and corresponding schematic of Ku heterodimer domains. Figure adapted from Fell and Schild-Poulter (2015) review [1]. Ku ribbon diagram bound and unbound by DNA. Crystal structure data of human Ku (PDB: IJEY) is colored in a domain-specific manner. Ku80 C-terminus domain is portrayed in isolation using NMR structural data (PDB: IQ2Z). In the Ku schematic, human, yeast, and prokaryote Ku subunits are compared while the Ku von Willebrand A (vWA) domain, DNA-binding domain, and SAF-A/B, Acinus and PIAS (SAP) or C-terminal domain, are color-matched to the ribbon diagram. Nuclear Localization Signal (NLS) is indicated as a thick black line. DNA-PKcs and Ku-binding motif (KBM) interaction sites are indicated, as are key post-translational modification (PTM) sites for phosphorylation and acetylation

