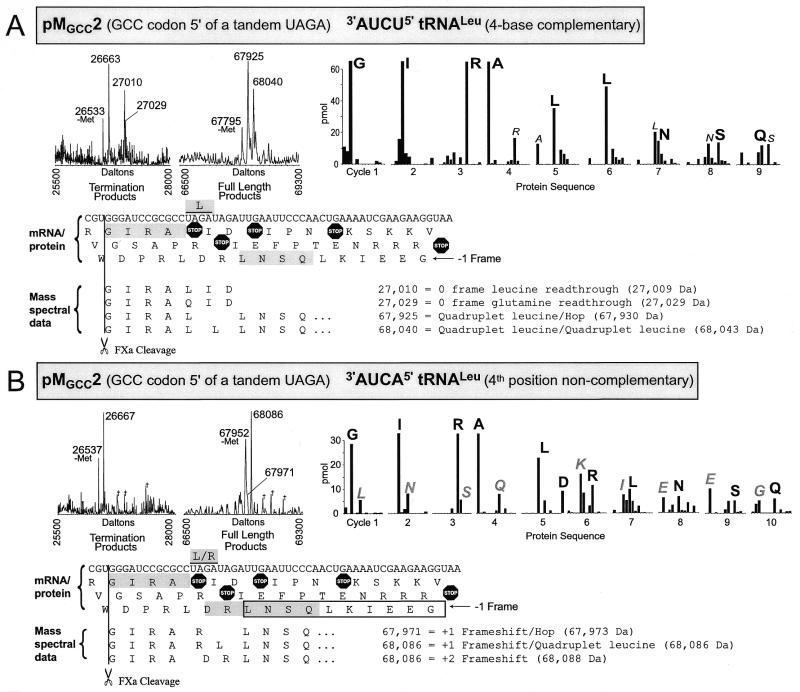
Figure 3.
Mass spectra and protein sequencing data shown for translation products of pMGCC2 translated in the presence of (A) 3′-AUCU-5′ tRNALeu with four base complementarity to the UAGA quadruplet or (B) 3′-AUCA-5′ tRNALeu which is non-complementary in the fourth quadruplet position. Molecular mass spectra show termination products and full-length fusion products. Peaks labeled ‘-Met’ are the result of in vivo N-terminal methionine removal from the protein ~131 Da higher in mass. Peaks labeled with daggers represent masses for which no protein interpretation was found. Interpretation of the products associated with the major peaks are shown by alignment of interpreted amino acid sequence below the mRNA sequence for the construct except for products terminating at UAG of the UAGA quadruplet which are not shown. Interpreted sequence for peaks representing standard termination and minus methionine proteins are not shown. Measured mass and the corresponding theoretical mass (in parentheses) are shown for each major peak. Theoretical mass values were calculated using average isotopes. For peptide N-terminal sequencing, vertical bars correspond to amino acid recovery for each cycle and are represented in the order, AEGIKLNQRSTVW, indicating all significant amino acids recovered. The protein sequence data for this figure only have an aspartic acid in cycle five and the amino acids represented by vertical bars for that cycle are in the order AEGIKLNQRSTVWD. The major amino acid recovered in each cycle is labeled in large black letters; minor amino acids are labeled with small italic letters; large gray letters label major secondary amino acid recovery where appropriate. Interpretations of the protein sequence data are shown superimposed on the mRNA 3-frame translated sequence with gray shaded boxes indicating the major sequence and outline boxes indicating the secondary sequences where appropriate. The plasmids generating the mRNA and the over-expressed modified tRNALeu are indicated in the figure.

