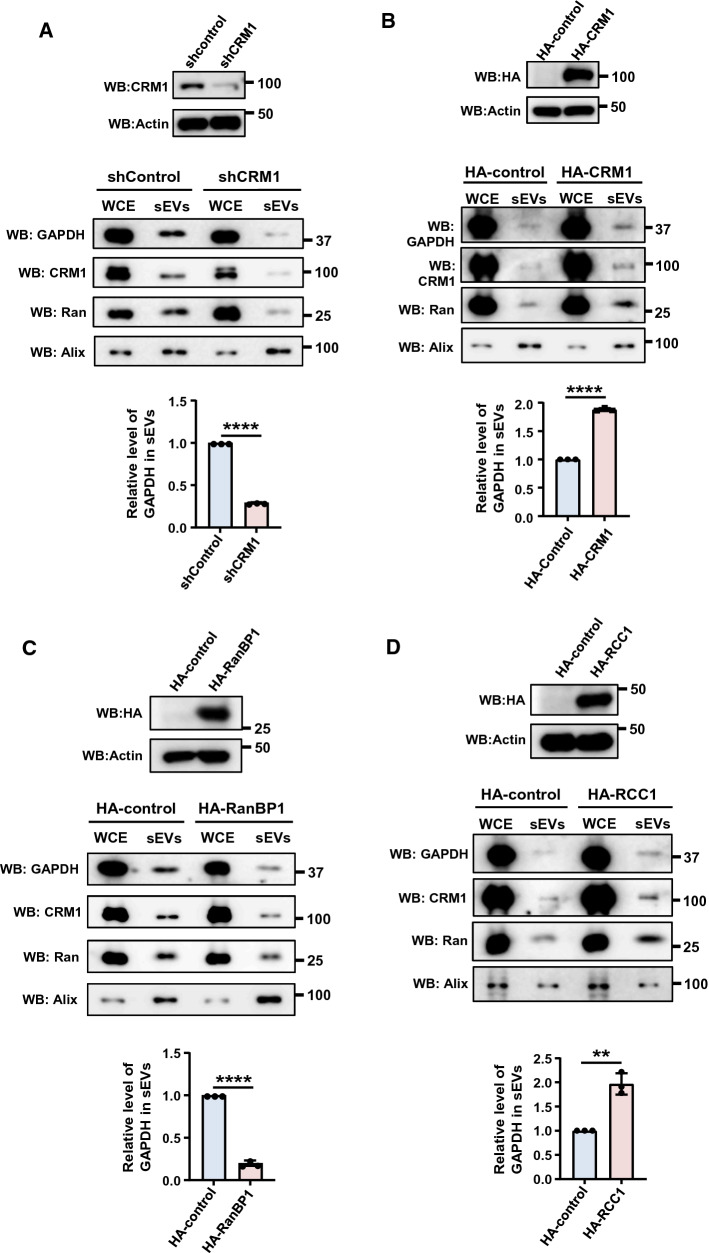
Fig. 5.
NCT is linked with recruitment of cargoes into sEVs. A HeLa cells harboring Inducible control shRNA (shControl) or CRM1 (shCRM1) were induced with doxycycline for 36 h. sEVs were isolated from the conditioned medium after a second round of doxycycline induction for 36 h. The depletion of CRM1 was analyzed by western blotting (top panel). The isolated sEVs were subjected to western blotting (WB) to analyze the relative levels of indicated proteins. Alix was used as sEV (exosome) marker (middle panel). Quantitative representation of relative levels of GAPDH normalized to that of Alix in the respective sEV samples (bottom panel). Data are presented as mean ± SEM from three independent experiments, P‐value was calculated using Student's t test and **P < 0.01. B HEK293T cells were transfected with pCI-neo-HA-empty-vector (HA-control) or HA-CRM1 construct for 16 h and forty eight hours later the sEVs were isolated. The expression of HA-CRM1 was analyzed by western blotting (top panel). sEVs were isolated and analyzed for levels of GAPDH, Ran and Alix (middle panel). Relative recruitment of GAPDH into sEVs, with respect to Alix, was calculated from three independent sets and plotted (bottom panel). Data are presented as mean ± SEM, P value was calculated using Student's t test and ****P < 0.0001. C HEK293T cells were transfected with pcDNA-empty-vector (HA-control) or HA-RanBP1 construct for 16 h and sEVs were isolated after 48 h. The expression of HA-RanBP1 was analyzed by western blotting (top panel). The sEVs isolated were analyzed for levels of GAPDH, Ran and Alix by western blotting (WB) (middle panel). Relative recruitment of GAPDH into sEVs, as compared to Alix, was calculated from three independent experiments and plotted (bottom panel). Data are presented as mean ± SEM, P value was calculated using Student's t test and ****P < 0.0001. D HEK293T cells were transfected with pcDNA-empty-vector (HA-control) or HA-RCC1 construct for 16 h and sEVs were isolated after 48 h. The expression of HA-RCC1 was analyzed by western blotting (top panel). The isolated sEVs were analyzed for levels of GAPDH, Ran and Alix by western blotting (WB) (middle panel). Relative recruitment of GAPDH into sEVs, as compared to Alix, was calculated from three independent experiments and plotted (bottom panel). Data are presented as mean ± SEM, P value was calculated using Student's t test and **P < 0.01

