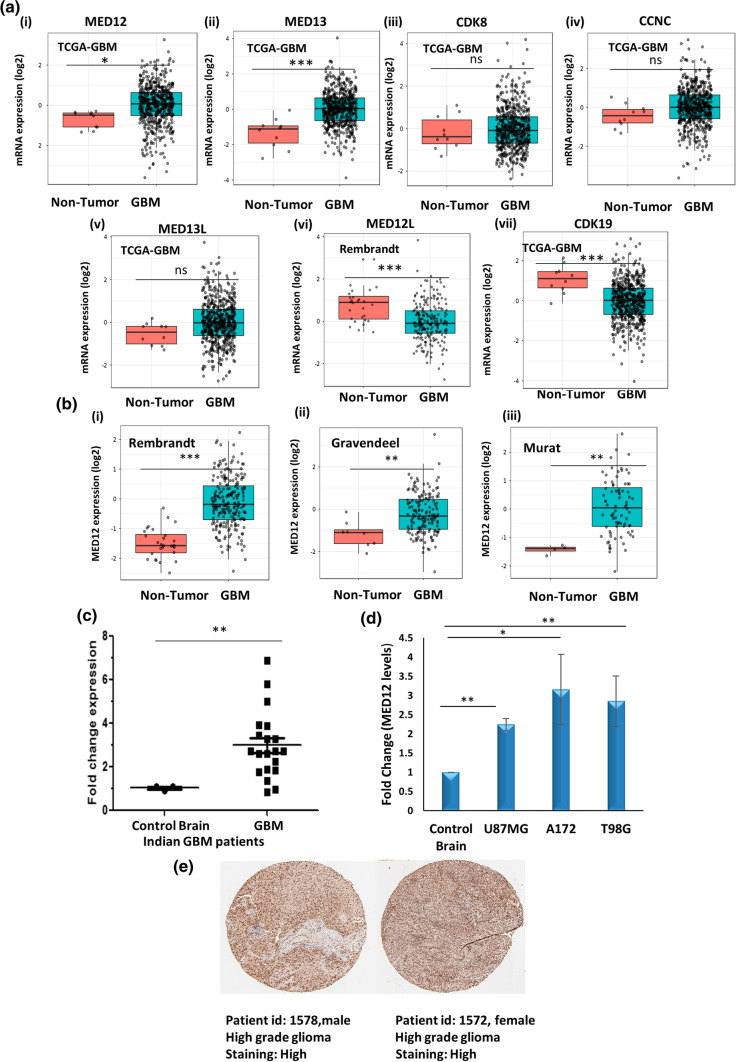
Fig. 1.
MED12 is over-expressed in glioblastoma patients and cell lines. GlioVis (a web application for data visualization and analysis to explore brain tumors expression datasets) was used for expression analysis of kinase subunits in TCGA-GBM (GBM (n) = 528, non-tumor (n) = 10) glioblastoma patient dataset. a Graph showing expression pattern of kinase subunits (MED12, MED13, CDK8, CCNC, MED13L, MED12L, CDK19) in TCGA_GBM patients (HG-U133A) versus non-tumor control. MED12L levels are shown from Rembrandt dataset. b Analysis of MED12 over-expression in glioblastoma in (i) Rembrandt patient dataset (GBM n = 219 non-tumor n = 28) (ii) Gravendeel patient dataset (GBM n = 159 non-tumor n = 8) (iii) Murat patient dataset (GBM n = 80 non-tumor n = 4). c Graph showing fold change in expression of MED12 in a cohort of 25 Indian glioblastoma patients versus non-tumor control (n = 3). d Graph showing fold change in expression of MED12 across three glioblastoma cell lines (A172, U87MG and T98G) versus normal brain RNA (Agilent MVP total brain mRNA). GAPDH was used for normalization. e Representative images of IHC of two glioma patients (patient id: 1572, gender: female, age: 55, glioma: high grade, antibody used: HPA003184; patient id: 1578, gender: male, age: 56, glioma: high grade, antibody used: HPA003184) showing over-expression in MED12 protein. Image was retrieved from the Human Protein Atlas. The graphical data points represent mean ± S.D of at least three independent experiments (* represents p value < 0.05 and ** represents p value < 0.001). Error bars denote ± SD

