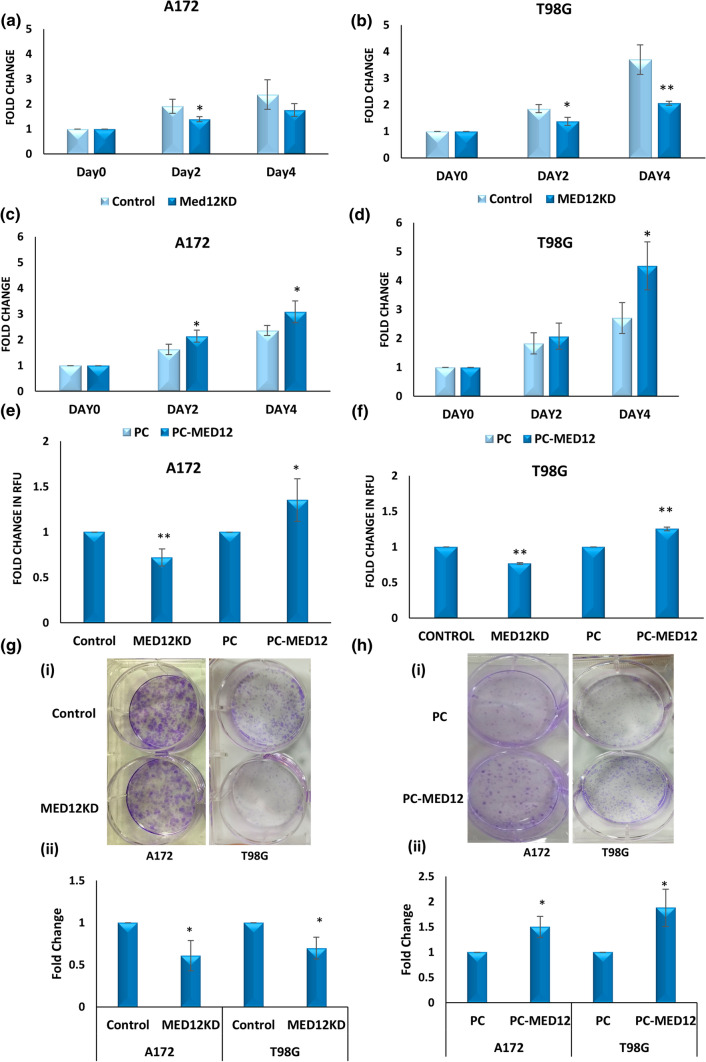
Fig. 3.
MED12 promotes cellular proliferation in glioblastoma. a, b Graph showing relative proliferation using MTT assay in cells transfected with MED12 siRNA or universal negative control siRNA in a A172 cells b T98G cells. c, d Graph showing relative proliferation using MTT assay in cells transfected with MED12 over-expressing plasmid or PC DNA 3.1(+) in c A172 cells d T98G cells. e Graph showing relative proliferation using cyquant cell proliferation assay in A172 cells having modulation in MED12 levels using MED12 siRNA and over-expressing plasmids as well as their respective controls. f Graph showing relative proliferation using cyquant cell proliferation assay in T98G cells having modulation in MED12 levels using MED12 siRNA and over-expressing plasmids as well as their respective controls. g, h Colony formation assay results in T98G and A172 cells upon g MED12 knockdown or h MED12 over-expression [(i) images of colonies (ii) graphical representation of fold change in number of colonies]. The graphical data points represent mean ± SD of at least three independent experiments (* represents p value < 0.05 and ** represents p value < 0.001). Error bars denote ± SD

