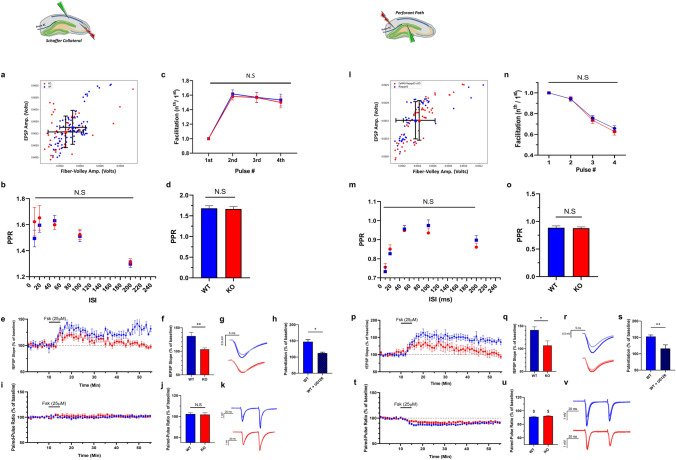
Fig. 3.
Comparison of short-term plasticity properties between Camk2α-cre+/-::RapGEF2fl/fl and WT mice. Results are shown symmetrically for the SC (a–k) and MPP (l–v) pathways. a and l Input/Output (I/O) curves obtained from RapGEF2fl/fl (blue trace) and Camk2α-cre+/-::RapGEF2fl/fl (red trace) mice. N = 8 slices, 4 mice per group. p > 0.05 for SC and MPP. b and m Results from a comparison of PPR values at different inter-spike intervals (ISIs). N = 7–11 slices, 4–6 mice, per group. Two-way repeated-measures ANOVA, p > 0.05. c and n Facilitation pattern that results from a burst of 4-stimulations given at 25 Hz. N = 7–11 slices, 4–6 mice, per group. Two-way ANOVA, p > 0.05. d and o A summary of the baseline PPR values obtained during subsequent experiments presented in e and p. ISI = 40 ms. N = 9–14 slices, 5–7 mice, per group. Two-way ANOVA, p > 0.05. e and p fEPSP slopes measurements before and after Fsk application. Results are shown for the two experimental groups; Camk2α-cre+/-::RapGEF2fl/fl (red) and their WT littermates (blue). N = 4–10 slices, 3–5 mice per group. Two-way repeated-measures ANOVA, p = 0.0174 (SC) and p = 0.0371 (MPP). f and q Summary results of fEPSP slopes show a significant impairment of Fsk-induced potentiation in slices obtained from Camk2α-cre+/-::RapGEF2fl/fl animals, unpaired student’s t-test, p = 0.001 (SC), p < 0.01 (MPP). g and r Representative traces of fEPSPs before (faint color) and 40 min after (bold color) Fsk administration for WT (blue) and Camk2α-cre+/-::RapGEF2fl/fl (red) conditions. h and s Results from comparing WT (floxed) slices that were applied with Fsk only, and slices that had a prior preincubation with U0126 (20 µM), and then applied with Fsk, show a significant decrease in potentiation. Unpaired student’s t-test, p = 0.01236 (SC), p = 0.0055 (MPP). i and t PPR measurements show no change in PPR values following Fsk administration in the SC pathway. On the other hand, similar measurements in the MPP show slight decrease in PPR values to a similar degree across genotypes. Two-way repeated-measures ANOVA, p > 0.05). j and u PPR mean values 40 min after Fsk application for the two experimental groups. k and v Representative traces of paired-pulse recordings before (faint color) and 40 min after (bold color) Fsk administration for WT (blue) and Camk2α-cre+/-::RapGEF2fl/fl (red) conditions

