Fig. 4.
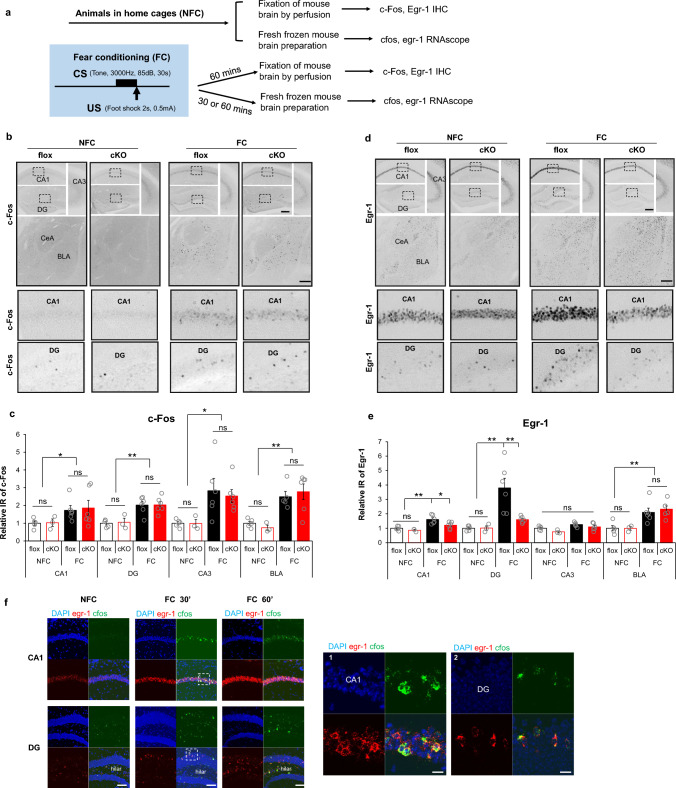
Differential dependency of RapGEF2 in fear conditioning-induced immediate early genes activation in hippocampal CA1 and DG. a Experimental procedure to examine IEGs activation after fear conditioning. b Representative images of cFos immunostaining in hippocampal CA1, DG and CA3 and basolateral amygdala of flox and cKO mice that were sacrificed 1 h after fear conditioning (FC) or stayed in the home cage (NFC). Scale bar: 200 µm. Lower panels are images with higher magnification of the boxed areas in the upper panels. c Quantification of cFos immunoreactivity in hippocampal subregions and basolateral amygdala of flox and cKO mice indicated that fear-conditioning induced cFos increase in all these regions. Immunoreactive (IR) signals for c-Fos from different brain areas as indicated were quantified by NIH Image J using the mean gray values of integrated density after being converted to gray scale. C-Fos IR from different groups was normalized to average value from flox mice in the home cage (NFC), to obtain “Relative IR of c-Fos”. No significant difference was observed between flox and cKO mice. N = 3 ~ 6 for animal number in each group. Two-way ANOVA followed by post hoc Bonferroni t-test, *p < 0.05, **p < 0.001. d Representative images of Egr-1 immunostaining in hippocampal CA1, DG and CA3 and basolateral amygdala of flox and cKO mice after fear conditioning. Scale bar: 200 µm. Lower panels are images with higher magnification of the boxed areas in the upper panels. e Quantification of Egr-1 immunoreactivity indicated that the fear-conditioning induced Egr-1 increase in CA1 and DG is RapGEF2-dependent. Immunoreactive (IR) signals for Egr-1 from different brain areas as indicated were quantified by NIH Image J using the mean gray values of integrated density after being converted to gray scale. Egr-1 IR from different groups was normalized to the average value for flox mice in the home cage (NFC), to obtain “Relative IR of Egr-1”. cKO mice with RapGEF2 ablation in CA1 and DG showed attenuated Egr-1 increase in CA1 and DG 1 h after fear conditioning, compared to flox mice. N = 3 ~ 6 for animal number in each group. Two-way ANOVA followed by post hoc Bonferroni t-test, *p < 0.05, **p < 0.001. f RNAscope with egr-1 (in red) and c-fos (in green) probes indicated that upregulation of c-fos mRNA in hippocampal CA1 and DG following fear conditioning occurred exclusively in the neurons with upregulation of egr-1 mRNA. Quantification of c-fos and egr-1 mRNA in hippocampal CA1 and DG 30 min after fear conditioning, 67.77% ± 10.92% of egr-1 positive neurons are cfos positive in CA1; 87.89% ± 7.67% of egr-1 positive neurons are cfos positive in DG. N = 3 for animal number in each group. Scale bar: 100 µm (left panels), 20 µm (right panels)

