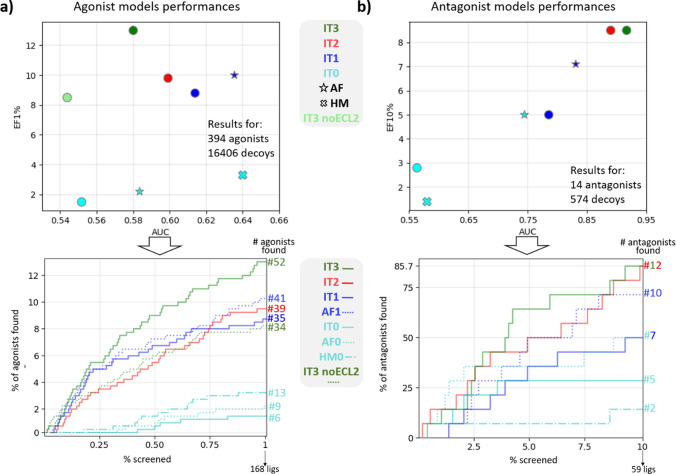
Fig. 2.
Models’ evaluation across iterations. a Models’ performances in terms of AUC and EF1% calculated by using the final dataset of agonists and decoys. Circles represents the models derived from IT0, different iterations are represented with different colors. All the models within this panel are intended to be “+”. IT# = model at iteration #; AF = AlphaFold model (at iteration 0: cyan star symbol; at iteration 1: blue star symbol); HM0 = homology model based on the TAS2R46 template (cyan “X” symbol: iteration 0). AF0, IT0, and HM0—all colored in cyan—are the original models (no IFD). In the bottom panel, the AUC showing the performances obtained for the top 1% of the results, including the number of agonists identified in the top 1% of the docked results ranked according to docking score. b Same as a for the antagonists (models “−”) with EF10% on y-axis

