Fig. 7.
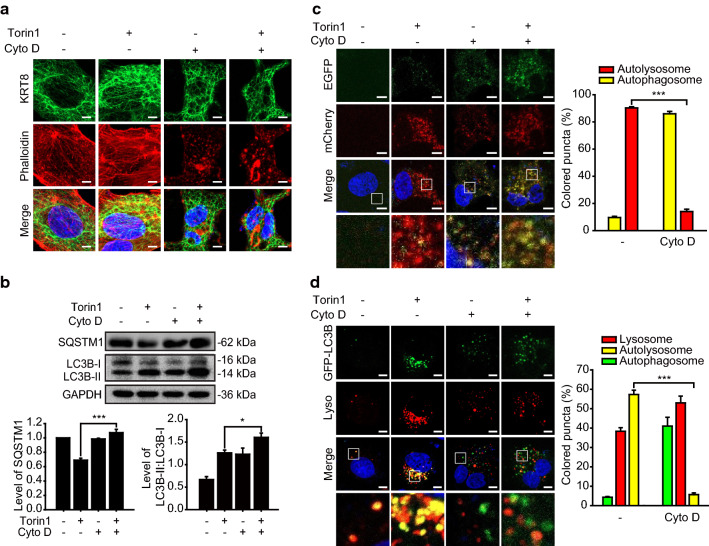
Disruption of actin filaments inhibits autophagosome–lysosome fusion. ARPE-19 cells were treated with Torin1 in the presence or absence of cytochalasin D (Cyto D) for 24 h. a Confocal microscopic images of KRT8-immunostained (green) and Alexa 555-Phalloidin-stained (red) ARPE-19 cells. Scale bar: 5 μm. b Immunoblots of autophagic markers (SQSTM1, LC3B) in ARPE-19 cells. Bar graphs indicate SQSTM1 expression level or the ratio of LC3B-II to LC3B-I. Each protein band intensity was normalized to GAPDH. Data are presented as the mean ± SEM, n = 3. *P < 0.01 ***P < 0.001. c Confocal microscopic images of mCherry-EGFP-LC3B-expressing ARPE-19 cells. Scale bar: 5 μm. Bar graph indicates the percentage of each fluorescence level in the merged images of mCherry-EGFP-LC3B under Torin1 treatment condition. Data are presented as the mean ± SEM, n = 3. ***P < 0.001. d Confocal microscopic images of LysoTracker Red-stained and GFP-LC3B-transfected ARPE-19 cells. Scale bar: 5 μm. Bar graph indicates the percentage of each fluorescence level in the merged images of GFP-LC3B and Lysotracker Red under MTOR inhibition condition. Data are presented as the mean ± SEM, n = 3. ***P < 0.001

