Fig. 8.
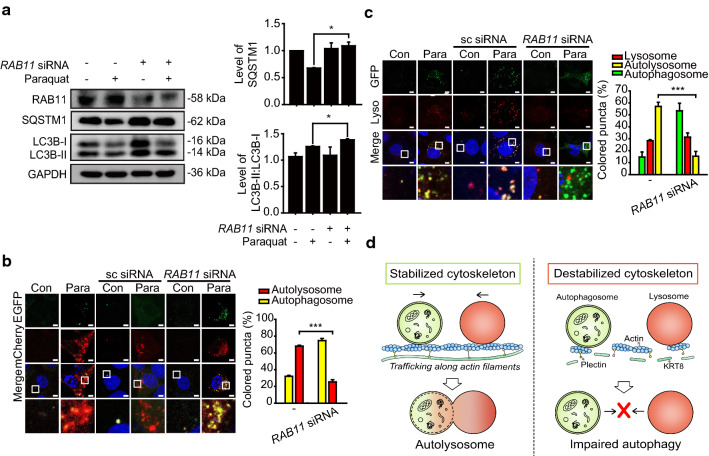
Expression level of RAB11-FIP2 is associated with autophagy progression in RPE cells under oxidative stress. a Immunoblots of RAB11-FIP2 (RAB11), SQSTM1, and LC3B in anti-RAB11-FIP2 siRNA-transfected ARPE-19 cells. Cells were treated with paraquat for 24 h. Bar graphs indicate SQSTM1 expression level or the ratio of LC3B-II to LC3B-I. Each protein band intensity was normalized to GAPDH. Data are presented as the mean ± SEM, n = 3. *P < 0.05. b Confocal microscopic images of mCherry-EGFP-LC3B-expressing ARPE-19 cells exposed to paraquat for 24 h. Scale bar: 5 μm. Bar graph indicates the percentage of each fluorescence level in the merged images of mCherry-EGFP-LC3B under paraquat treatment condition. Data are presented as the mean ± SEM, n = 3. ***P < 0.001. c Confocal microscopic images of LysoTracker Red-stained and GFP-LC3B-transfected ARPE-19 cells. Cells were treated with paraquat for 24 h. Scale bar: 5 μm. Bar graph indicates the percentage of each fluorescence level in the merged images of GFP-LC3B and Lysotracker Red under oxidative stress condition. Data are presented as the mean ± SEM, n = 3. ***P < 0.001. d Graphical summary of the results

