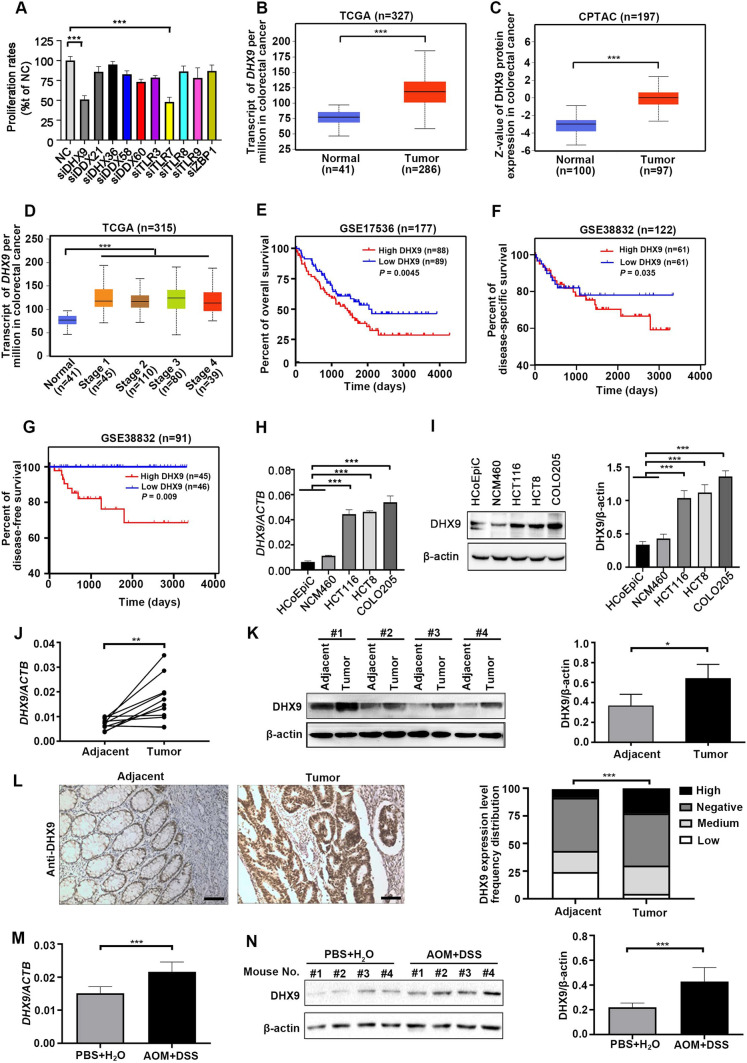
Fig. 1.
siRNA screening identifies DHX9 as an oncogenic molecule in colorectal cancer. A Forty-eight hours after HCT116 cells were transfected with a negative control (NC) siRNA or siRNA against nucleic acid sensing pattern recognition receptors (PRRs), EdU proliferation assay was conducted with high-throughput siRNA screening. ***P < 0.001; Student’s t test. (B-C) The mRNA (B) and protein (C) levels of DHX9 in colorectal cancer (CRC) tissues and normal adjacent tissues in TCGA and CPTAC database, respectively (obtained through UALCAN; http://ualcan.path.uab.edu/index.html). ***P < 0.001; Student’s t test. (D) DHX9 mRNA expression in different CRC stages and normal tissues from the TCGA Dataset. ***P < 0.001; Student’s t test. E Relationship of DHX9 expression with overall survival in patients with CRC in the cohort of GSE17536 database, log-rank test. F The disease-specific survival of patients with low and high DHX9 expression obtained from GSE38832 database, log-rank test. G Association of DHX9 expression with disease free survival of CRC patients in GSE38832 dataset, log-rank test. H The mRNA levels of DHX9 in human normal colonic epithelial cells (HCoEpiC and NCM460) and CRC cells (HCT116, HCT8, and COLO205) were detected by RT-qPCR analysis. ***P < 0.001; one-way ANOVA, post hoc comparisons, Tukey’s test. (I) The protein levels of DHX9 in normal colonic epithelial cells and CRC cells were examined by Western blotting analysis and quantitative data of DHX9 protein levels were shown. ***P < 0.001; one-way ANOVA, post hoc comparisons, Tukey’s test. J The mRNA levels of DHX9 in paired human clinical CRC tissues and corresponding adjacent colorectal tissues (n = 11). **P < 0.01; Student’s t test. K Left, the representative ECL images of DHX9 detected by Western blotting analysis in paired human clinical CRC tissues and corresponding adjacent colorectal tissues. Right, the summary data correspond to Left (n = 3). *P < 0.05; Student’s t test. L Left, representative IHC micrographs of DHX9 staining in paraffin embedded clinical CRC tissues and adjacent normal tissues. Scale bar, 100 μm. Right, rank sum test analysis of IHC results of DHX9 in CRC tissue and adjacent normal tissues (n = 220). ***P < 0.001. M The difference of DHX9 mRNA levels in colorectal tissues of AOM/DSS-treated mice and PBS-treated mice (n = 7). ***P < 0.001; Student’s t test. N Left, the representative ECL images of DHX9 in AOM/DSS-treated mice and PBS-treated mice. Right, the summary data in AOM/DSS-treated group and PBS control group correspond to Left (n = 3). ***P < 0.001; Student’s t test. Data were represented as mean ± SEM from three independent replicate experiments in A, H, I, J, K, M and N

