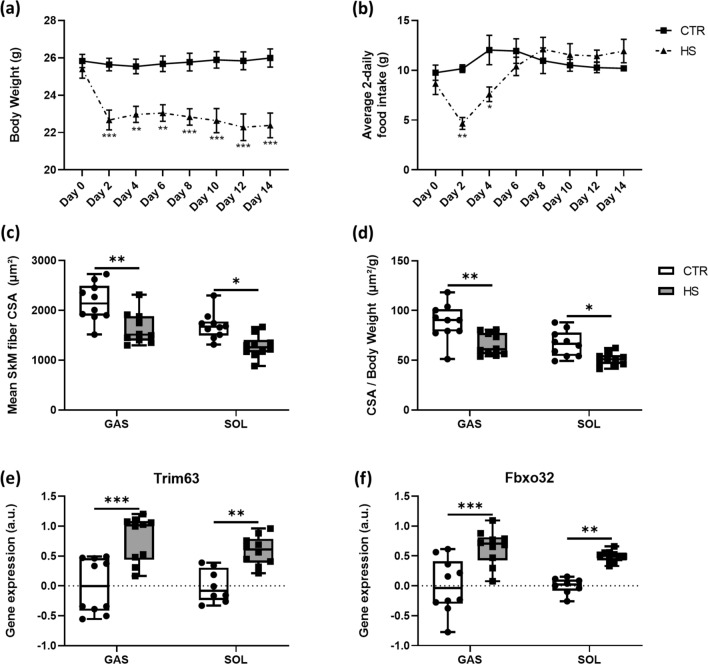
Fig. 1.
Skeletal muscle unloading modulates body weights, food intake, fiber cross-sectional area (CSA) and atrophy-related E3 ligases. a Body weight developments and b food intake in CTR (n = 10) and HS (n = 10) mice. c Mean skeletal muscle CSA between CTR (n = 10) and HS (n = 10) mice in GAS and SOL muscle fibers. d CSA/body weight ratios for GAS and SOL of CTR and HS mice. Statistical analysis used was two-way repeated measures ANOVA with Sidak’s multiple comparison post hoc test. Relative gene expression profiles of e Trim63 and f Fbxo32 between CTR and HS mice in GAS and SOL muscles. Statistical analysis used was two-way ANOVA with Sidak’s multiple comparison post hoc test on the following number of animals: GAS 10 CTR and 10 HS animals, SOL 8 CTR and 10 HS animals. *p value < 0.05; **p value < 0.01; ***p value < 0.001

