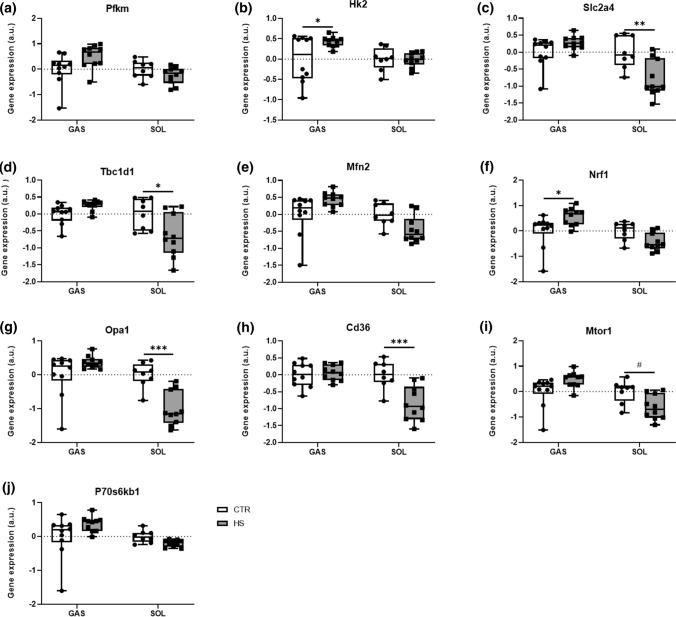
Fig. 5.
Metabolism-related gene expressions alter upon HS conditions. Relative gene expression profiles of a Pfkm, b Hk2, c Slc2a4, d Tbc1d1, e Mfn2, f Nrf1, g Opa1, h Cd36, i Mtor1, and j P70s6kb1 between CTR and HS mice in GAS and SOL muscles. Expression is relative to the housekeeping gene Rpl41. Statistical analysis used was two-way ANOVA with Sidak’s multiple comparison post hoc test on the following number of animals: GAS 10 CTR and 10 HS animals, SOL 8 CTR and 10 HS animals. *p value < 0.05; **p value < 0.01; ***p value < 0.001; #p value = 0.05–0.1

