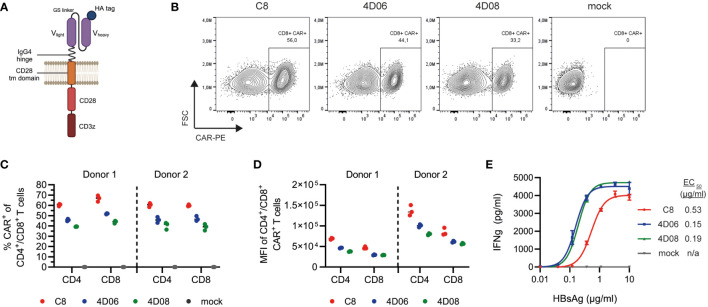
Figure 3.
Expression and functional characterization of CARs using different S-binders. (A) Schematic representation of CAR constructs. (B) Exemplary flow cytometry plots of retroviral transduction of primary human CD8+ T cells with C8-, 4D06-, and 4D08-CARs. (C) Transduction rates of CD4+ and CD8+ T cells from two healthy donors for C8-, 4D06-, and 4D08-CARs determined by flow cytometry. (D) Expression levels of C8-, 4D06-, and 4D08-CARs shown as mean fluorescence intensity (MFI) of CAR+ population (does not apply to mock cells). (E) 1x10⁵ CAR-transduced T cells were cultured on plate-bound HBsAg titrated from 0.01-10 µg/ml. IFNγ secretion was measured after 48h by ELISA. Data points represent mean values ± SD from triplicates.

