
Fig. 8.
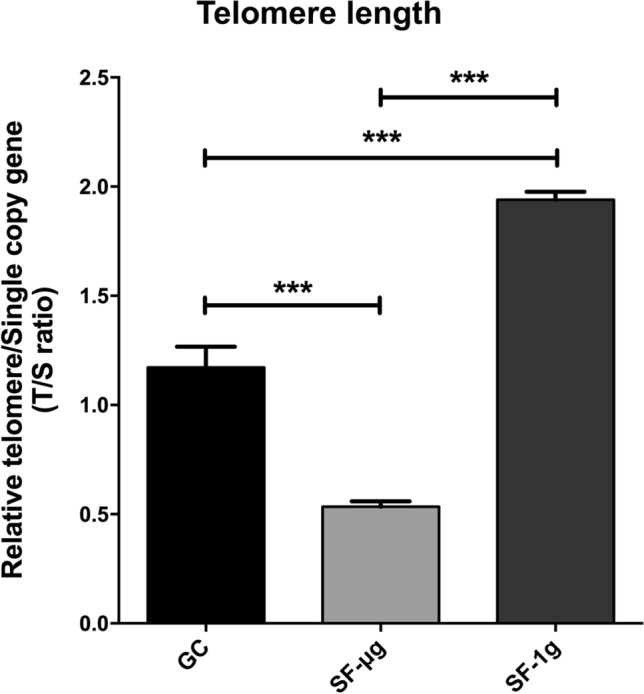
Telomere length analysis. Multiplex PCR showed that the relative telomere length of SF samples changes in a statistically significant way compared to GC samples. Specifically, T/S ratio of SF-μg is about 50% less than GCs. T/S ratio of SF-1g samples is 50% more than GCs. Statistical analysis was performed with one-way ANOVA and Bonferroni multiple comparison post-hoc tests. Horizontal lines denote mean ± SEM. ***p ≤ 0.001