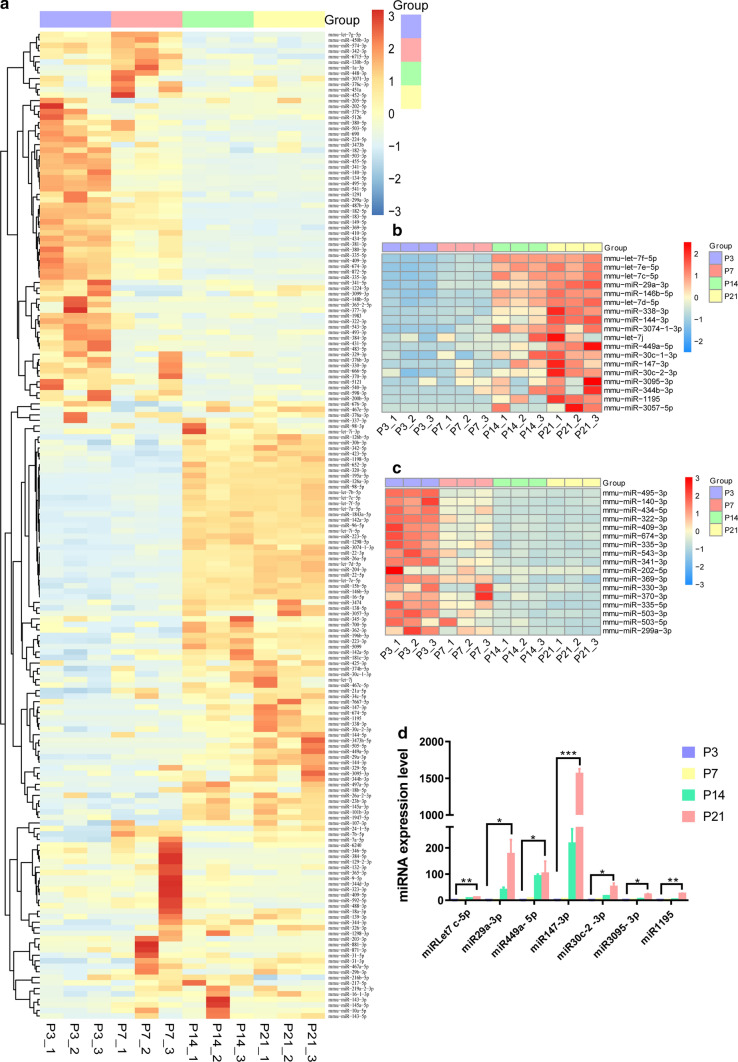
Fig. 3.
The differentially expressed cochlear sEV miRNAs from P3, P7, P14, and P21 mice. a Heatmap of the differentially expressed miRNAs. b Heatmap of the up-regulated miRNAs as mice age. c Heatmap of the down-regulated miRNAs as mice age. d qPCR verification of some differentially expressed miRNAs. Values lower and higher than the mean are shown by blue and red scales, respectively. *p < 0.05, **p < 0.01, ***p < 0.001, n = 3

