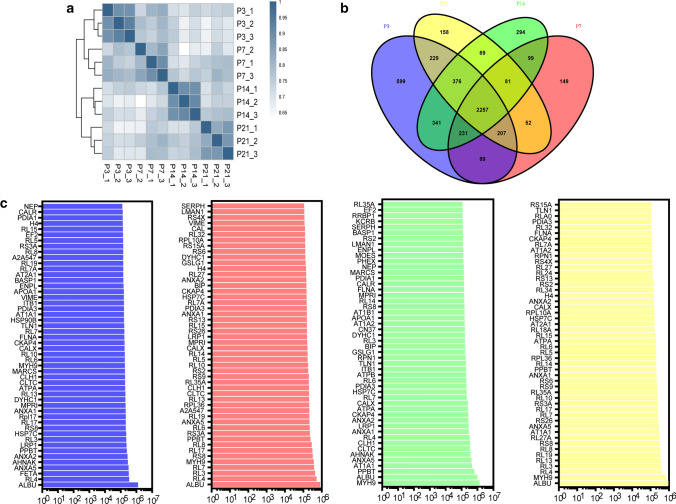
Fig. 5.
Proteomics analysis of cochlear sEV proteins from P3, P7, P14, and P21 mice. a Cluster analysis of cochlear sEV proteomics data. b The Venn diagram of cochlear sEV proteomics data. c The top 50 most highly expressed proteins of cochlear sEVs from P3 (blue), P7 (red), P14 (green), and P21 (yellow) mice

