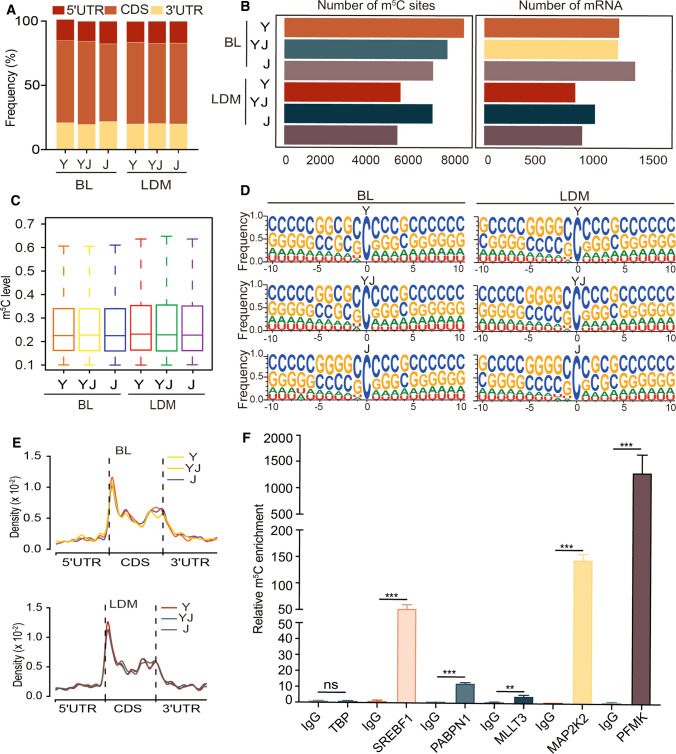
Fig. 2.
Distribution of mRNA m5C in BL and LDM from three different pig breeds. A Transcriptome-wide distribution of mRNA m5C sites. The bar chart shows the percentages of m5C sites within distinct mRNA regions: the 5’UTR, the CDS and the 3’UTR. B Bar charts showing the numbers of m5C sites (left) and m5C-modified mRNAs (right) in BL and LDM from Y, YJ and J. C Boxplots showing the overall distributions of mRNA m5C levels in BL and LDM from Y, YJ and J. D Sequence frequency logo for the sequences proximal to mRNA m5C sites. E The m5C distributions pattern within mRNA in different regions. F m5C-RIP-qPCR analysis of representative m5C-modified genes. TBP served as an unmodified negative control. Error bars, means ± S.D., n = 3. The P values were determined using Student’s t tests. *P < 0.05 **P < 0.01, ***P < 0.001

