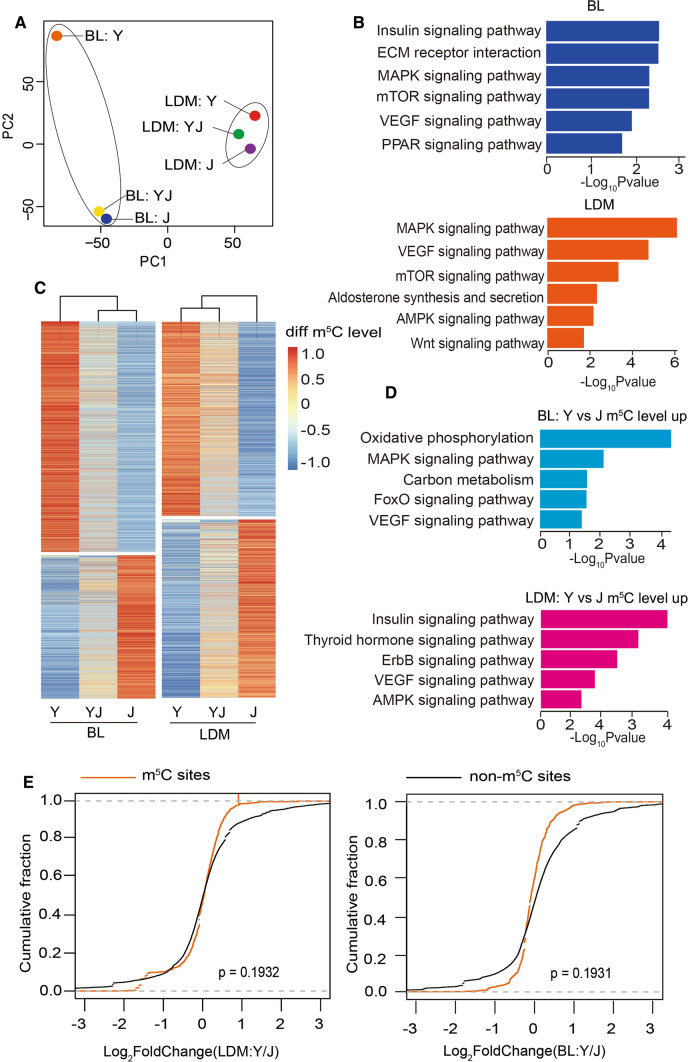
Fig. 3.
Hypermethylated m5C in BL and LDM strongly relate to fatness/growth-related phenotypes. A PCA analysis of m5C in BL and LDM from Y and YJ. B Bar plot showing the result of KEGG pathway analysis of m5C-modified mRNAs in BL and LDM (all m5C-modified mRNAs combined from Y, YJ and J). C Heatmap and cluster analysis of differentially m5C-modified sites (|Y-J|> 0.05) in BL and LDM from Y, YJ, and J. D Bar plot showing the result of KEGG pathway analysis of mRNAs with hypermethylation in BL and LDM of Y compared with J. E Cumulative distribution analysis of the expression level changes in mRNAs with or without m5C modification

