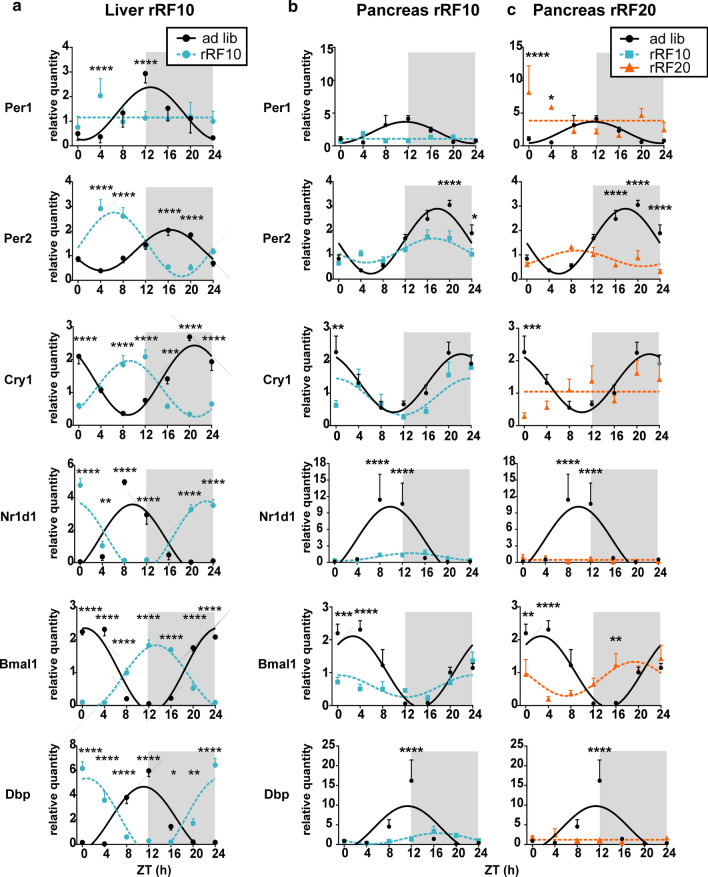
Fig. 2.
Clock gene expression in the liver and pancreas homogenates. Comparison of daily profiles of relative expression of Per1, Per2, Cry1, Nr1d1, Bmal1 and Dbp detected by RT-qPCR in animals fed ad libitum (ad lib) and exposed to reversed restricted feeding protocols (rRF10 and rRF20). Data were fit with cosine curves (for details, see “Materials and methods” section). a Liver; ad libitum circles and full line, rRF10 circles and dashed line, significant differences between groups at individual time points are depicted as indicated by two-way ANOVA post hoc analysis *P < 0.05, **P < 0.01; ***P < 0.001; ****P < 0.0001. b Pancreas; ad libitum circles and full line, rRF10 squares and dashed line. c Pancreas; ad libitum circles and full line, rRF20 triangles and dashed line. Data are expressed as mean ± SEM. Data were fitted with a horizontal straight line (null hypothesis) or a cosine curve (alternative hypothesis), compared by the extra sum-of-squares F test and plotted accordingly. Significant differences between groups at individual time points are depicted as indicated by two-way ANOVA post hoc analysis, due to multiple comparisons, alpha was adjusted *P < 0.025, **P < 0.005; ***P < 0.0005; ****P < 0.00005

