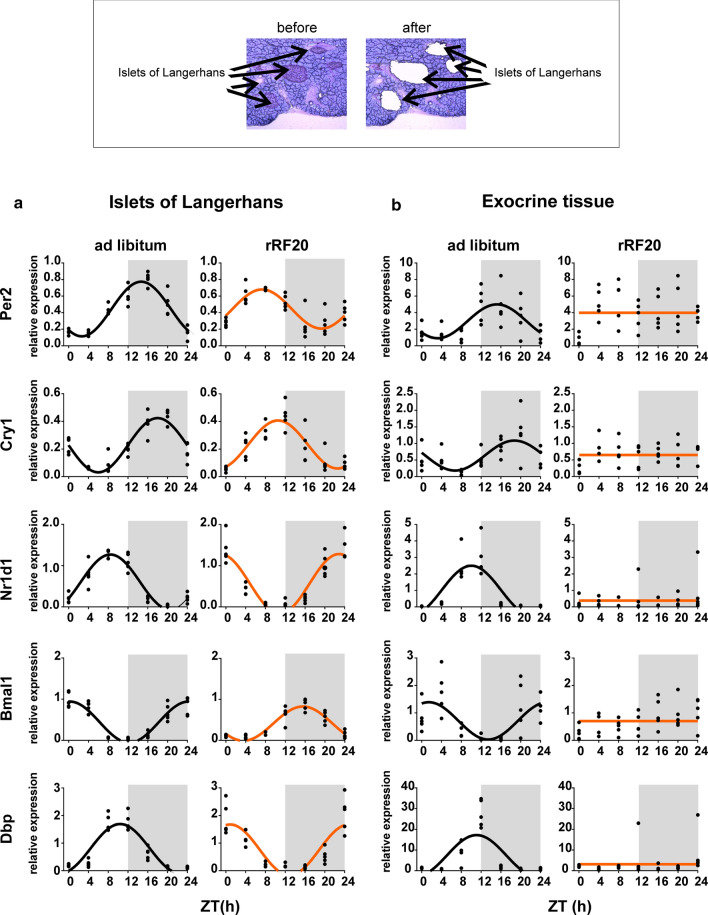
Fig. 3.
Gene expression in the separated endocrine and exocrine pancreatic tissue. Representative sections of the pancreas to demonstrate separation of the endocrine pancreas (islets of Langerhans) and the exocrine pancreas (acinar cells) using laser microdissection (upper part). Daily profiles of relative expression of Per2, Cry1, Nr1d1, Bmal1 and Dbp in animals fed ad libitum compared to animals on rRF20 protocol were detected using real-time RT-qPCR. Data were fitted with a horizontal straight line (null hypothesis) or a cosine curve (alternative hypothesis), compared by the extra sum-of-squares F test and plotted accordingly. a Endocrine pancreas (islets of Langerhans). b Exocrine (acinar cells) pancreatic tissue. Individual values at each time point are shown

