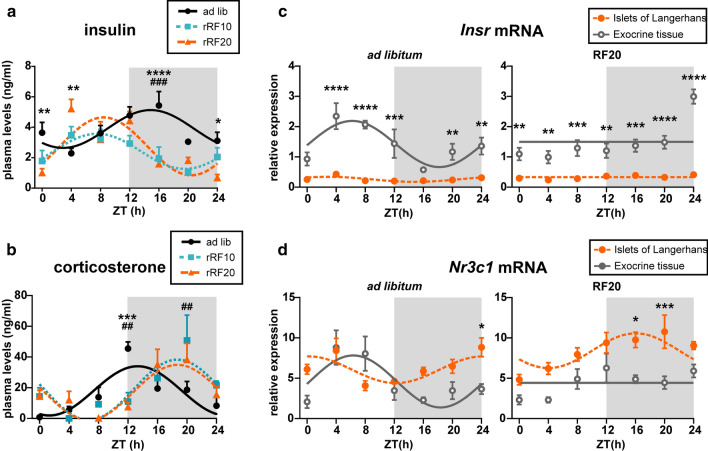
Fig. 5.
Levels of insulin and corticosterone in blood plasma and their receptors in the endocrine and exocrine pancreas. Daily profiles of a insulin and b corticosterone levels in the plasma of animals which were fed ad libitum (circles, full line), or exposed to 10 days (squares, dotted line) and 20 days (triangles, dashed line) of restricted feeding protocols (rRF10 and rRF20). Daily profiles of c Insr and d Nr3c1 mRNA in laser-dissected endocrine (islets of Langerhans; full circles) and exocrine pancreas (open circles) of animals fed ad libitum and exposed to rRF20. Data are depicted as mean ± SEM and fitted cosine curves. Significant differences between groups at individual time points identified by two-way ANOVA post hoc analysis are shown. *P < 0.05, **P < 0.01, ***P < 0.001, ****P < 0.0001 ad libitum vs. RF20; ##P < 0.01, ###P < 0.001 ad libitum vs. RF10

