Fig. 6.
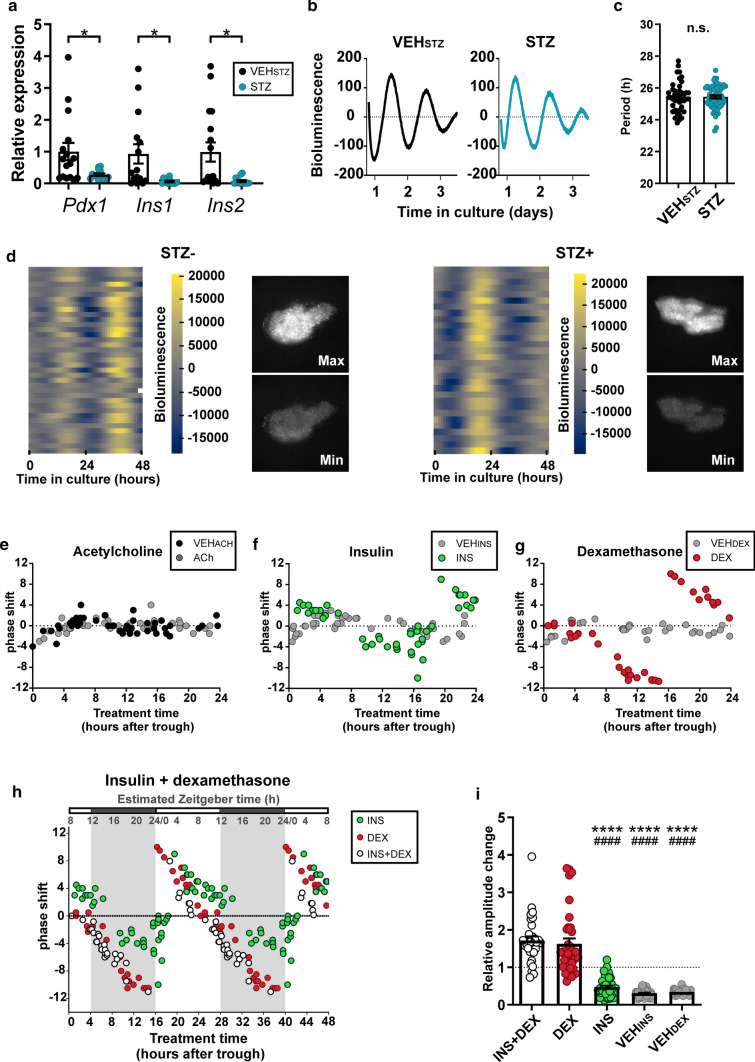
Bioluminescence recording in exocrine pancreatic explants from mPer2Luc mice. a Relative expression of Pdx1, Ins1 and Ins2 (β-cell markers) in STZ treated organotypic explants. b Representative examples of bioluminescence recording of the pancreatic organotypic explants. c STZ treatment did not affect the period of the clock in the pancreatic explant. d Bioluminescence recording of cellular oscillators in the pancreatic explants without (left side) and with STZ (right side) treatments. Normalized heatmaps, in which each line represents the bioluminescence of a tracked single cell. Snapshots of the same exocrine pancreatic explant depict the maximum and minimum of PER2-driven bioluminescence in the whole sample. e–g Phase response curves (PRC) constructed for the treatments of the exocrine pancreatic explants with e acetylcholine (ACh), f insulin (INS) and g dexamethasone (DEX) and corresponding vehicles (VEHACh/INS/DEX). h PRCs for treatment with DEX and INS were double plotted for better comparison with PRC for treatment with a combination of insulin and dexamethasone (INS + DEX). The external time (Zeitgeber time; ZT) is depicted in the upper scale (shaded area denotes dark period of the light/dark cycle). ZT was extrapolated by correlating the peaks of PER2-driven bioluminescence in vitro and Per2 mRNA levels detected in the exocrine pancreatic tissue in vivo (for more details, see “Materials and methods” section). i Relative amplitude changes of bioluminescence rhythms after the treatments of exocrine pancreatic explants with DEX, INS, DEX + INS and corresponding vehicles (VEHDEX and VEHINS). Data are expressed as mean ± SEM. *P < 0.05; ****P < 0.0001 vs. INS + DEX; ####P < 0.0001 vs. DEX

