Fig. 5.
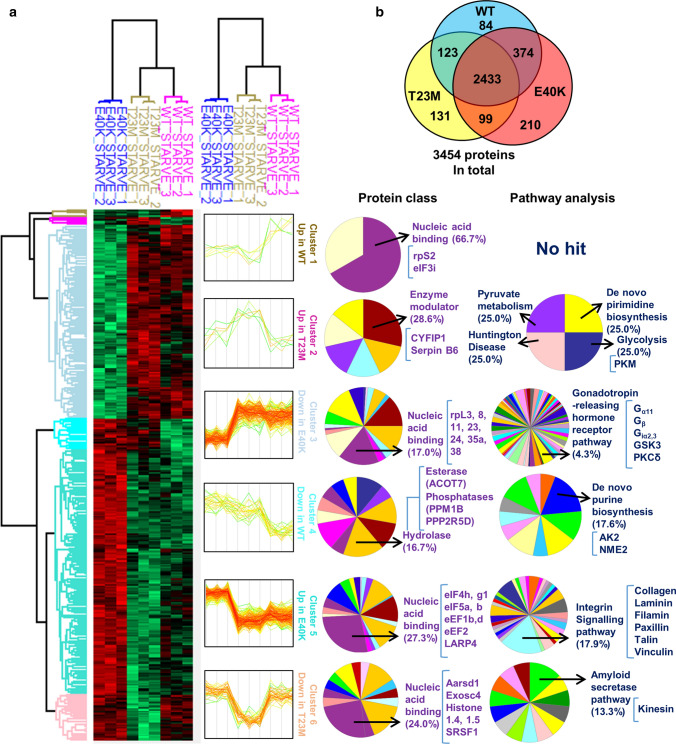
MS analysis of Rheb-WT, T23M and E40K expressing cells show distinct changes to the proteome. a NIH3T3 cells stably over-expressing Rheb-WT, T23M or E40K were starved of serum for 72 h before being subjected to MS analysis. Heat-map illustrates six distinct clusters as indicated. Proteins identified from each cluster were classified using the online bioinformatics source portal gene ontology (geneontology.org) according to their class and involvement in signalling pathways or other processes. Top hits from each protein class or signalling pathway group are shown. b Venn diagram illustrates the number of identified proteins whose abundances differ significantly from other cell groups

