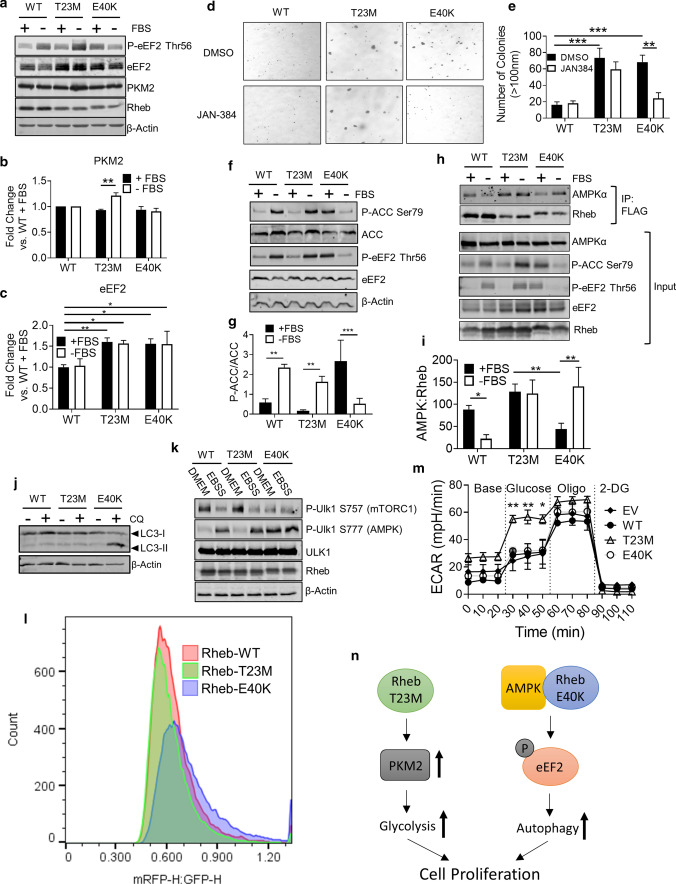
Fig. 6.
Rheb-T23M and E40K drive cancer through distinct mechanisms. a Immunoblot analysis of lysates harvested from NIH3T3 cells stably expressing indicated Rheb mutant. Immunoblots were probed with antibodies for the indicated proteins or phosphorylation sites. Cells were grown in DMEM lacking FBS for 72 h prior to harvest. b Quantification of a for ratio of PKM2: β-actin. c Quantification of a for ratio of eEF2: β-actin. d Colony formation assay for 1 × 10⁵ NIH3T3 cells stably expressing the indicated Rheb mutant. Liquid medium was changed twice per week for fresh medium containing either DMSO or 1 µM JAN-384. The number of colonies larger than 100 nM was counted by hand and is quantified in e. f Immunoblot analysis using the indicated antibodies of NIH3T3 cells stably expressing the indicated Rheb mutant. Cells were grown in either fully supplemented media or starved of serum for 24 h prior to harvest. g Quantification of f for the ratio of P-ACC:ACC normalized to β-actin. h Immunoprecipitation with anti-FLAG antibody of lysates harvested from NIH3T3 cells stably expressing the indicated Rheb mutant, followed by immunoblot analysis for the indicated proteins or phosphoproteins. i Quantification of h for co-immunoprecipitated AMPK normalized to immunoprecipitated FLAG-Rheb. j Western blot analysis for LC3 of NIH3T3 cells stably expressing the indicated Rheb mutant (positions of LC3-I and -II are shown). Cells were treated with either DMSO or 10 µM CQ, as indicated, for 2 h. k NIH3T3 cells stably expressing the indicated Rheb mutant we grown in fully supplemented media followed by treatments with EBSS as indicated for 2 h. Lysates were collected and western blot analysis performed with the indicated antibodies. l Flow cytometric analysis of tf-LC3 HeLa cells transiently expressing Rheb-T23M or E40K. Cells were gated to include only singlets and to exclude dead cells. Flow was stopped after 30,000 cells had been detected. Figure represents the ratio of mRFP1-H:EGFP-H. m Seahorse assay of extracellular acidification rate of HEK293 cells transfected with empty vector control or indicated Rheb mutant. For all figures error bars indicate SD for three independent experiments. n Diagram depicting how Rheb T23M and E40K drive cell proliferation via different pathways. For panels b, c, e, g, i and m, n = 3 (means ± S.D.). Statistical significance was determined by Student’s t-test where **0.001 ≤ P < 0.01; ***P < 0.001

