Fig. 4.
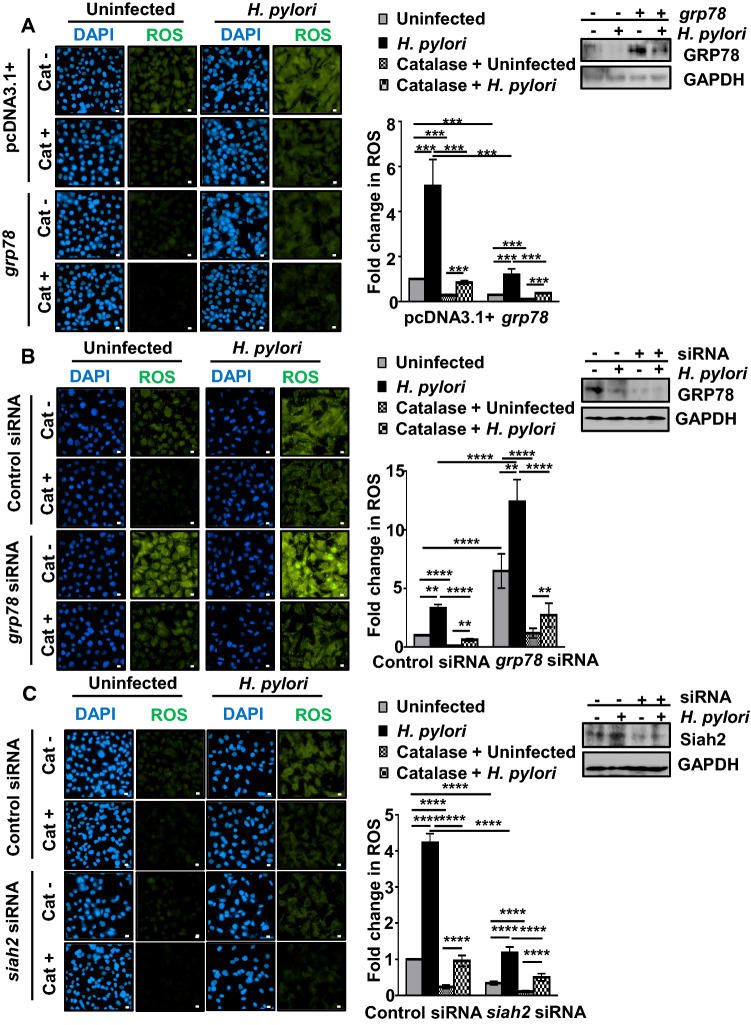
GRP78 is crucial in the regulation of ROS in H. pylori-infected GECs. A Micrographs depicting ROS generation in uninfected or H. pylori-infected (200 MOI, 12 h) empty vector and grp78 stably-expressing AGS cells. Cat+/Cat− refer to catalase-treated/catalase-untreated cells, respectively. Western blots represent the status of GRP78 in uninfected or infected empty vector and grp78 stably-expressing AGS cells. GAPDH = loading control. Graphs represent fold change in ROS generation. B Fluorescence microscopy images representing ROS generation in AGS cells transfected with control and grp78 siRNA for 36 h followed by 12 h of H. pylori infection. Cat+/Cat− refer to catalase-treated/catalase-untreated cells, respectively. Western blots represent the status of GRP78 protein expression after grp78 suppression and H. pylori infection. GAPDH = loading control. Fold change in ROS generation is represented by bar graphs. C Micrographs depicting ROS generation in uninfected or infected control and siah2 suppressed AGS cells. Cat+/Cat− refer to catalase-treated/catalase-untreated cells, respectively. Western blots represent the status of Siah2 protein expression in the same experimental setup. GAPDH = loading control. Graphs represent fold change in ROS generation. For all images, scale bars = 10 μm. Graphs = mean ± sem. n = 3. Statistical significance is determined by three-way ANOVA followed by Tukey’s post hoc analysis. **P < 0.01, ***P < 0.001, ****P < 0.0001

