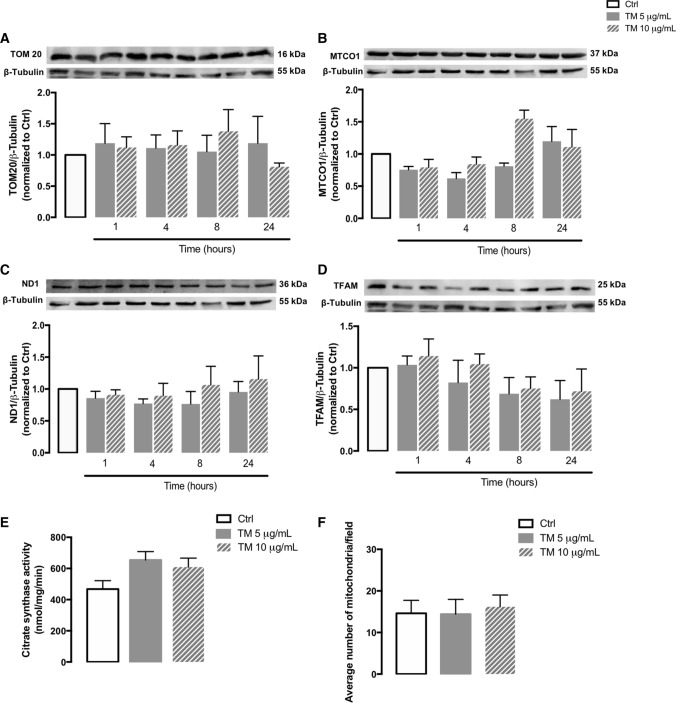
Fig. 4.
Mitochondrial mass and number in human THP-1 monocytes upon ER stress. Protein levels of TOM20 (A), MTCO1 (B), ND1 (C) and TFAM (D) were quantified by WB in total cellular extracts obtained after incubation of THP-1 cells with 5 or 10 μg/mL TM, during the indicated time periods (1–24 h). β-Tubulin I was used as a control for protein loading and to normalize the levels of the protein of interest. Results were calculated relatively to control values and represent the mean ± SEM of at least three independent experiments. Mitochondrial citrate synthase activity (E) was evaluated in total cell lysates obtained after incubation of THP-1 cells with 5 or 10 μg/mL TM for 8 h. Results were expressed in nmol/mg/min and represent the mean ± SEM of at least three independent experiments. The number of mitochondria (F) was also determined in human THP-1 monocytes treated with 5 or 10 μg/mL TM for 8 h and compared to untreated cells, by analyzing TEM images (Fig. 3). Statistical significance between control and TM-treated cells was determined using the one-way ANOVA test, followed by Dunnett’s post hoc test

