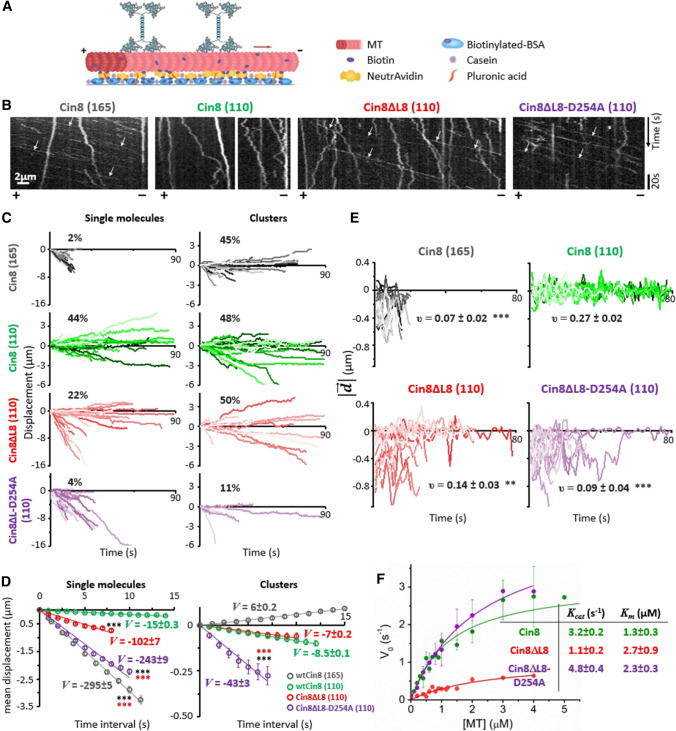
Fig. 3.
L8 induces bi-directional motility of single Cin8 molecules. A Schematic representation of the single-molecule motility assay. Red arrow represents the direction of movement of single Cin8 molecules under high ionic strength conditions. B Representative kymographs of motility of three variants of Cin8 on surface-bound MTs in the presence of 1 mM ATP. Polarity of the MTs is indicated at the bottom of the kymographs. Arrows indicate selected fast-moving and minus-end directed motility trajectories. C Displacement trajectories of Cin8 variants of single Cin8 molecules and clusters in the presence of 1 mM ATP. The percentage of plus-end directed trajectories is indicated in each plot. D Mean displacement (MD) analysis of trajectories of single Cin8 molecules and clusters shown in C. At t = 7 s, ***P < 0.001, compared to WT Cin8 (black asterisks) and to Cin8ΔL8 (red asterisks), calculated using two way ANOVA, followed by Tukey's test. The solid lines represent linear (MD = V·t) fits. Velocity values (V, nm/s ± SD) are indicated. E Instantaneous displacement () over a 3-s moving window, with 1-s interval, as a function of time. The variants of Cin8 and salt conditions (mM KCl) are indicated on top of each panel. υ indicates the average frequency (s−1 ± SEM) of directionality changes (n = 20). **P < 0.01; ***P < 0.001, compared to WT Cin8 at 110 mM KCl, calculated using one way ANOVA, followed by Tukey's test. B–E KCl concentrations, 165 or 110 mM, are indicated in parentheses. F ATPase activity of recombinant motor domain variants (Fig. S5) in the presence of 1 mM ATP. Kcat and Km values are indicated

