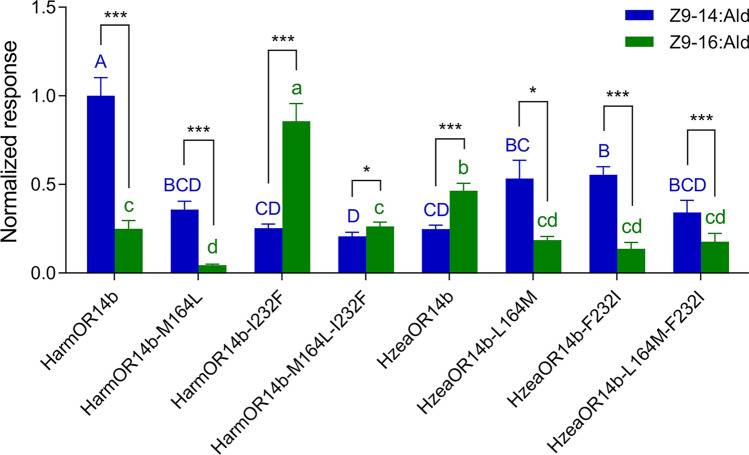
Fig. 5.
Comparison of the response of HarmOR14b, HzeaOR14b, and their mutants at position 232 to Z9-14:Ald and Z9-16:Ald. The response of HarmOR14b, HzeaOR14b, and their mutants to Z9-14:Ald and Z9-16:Ald at a concentration of 10−4 M. Response values were normalized by defining the mean response of HarmOR14b to Z9-14:Ald as 1. The response to Z9-14:Ald and Z9-16:Ald of the two receptors and mutants are compared individually, with each column with a different letter indicating a significant difference. Error bars indicate SEM (n = 8–13), one-way ANOVA, Duncan test; paired t-test

