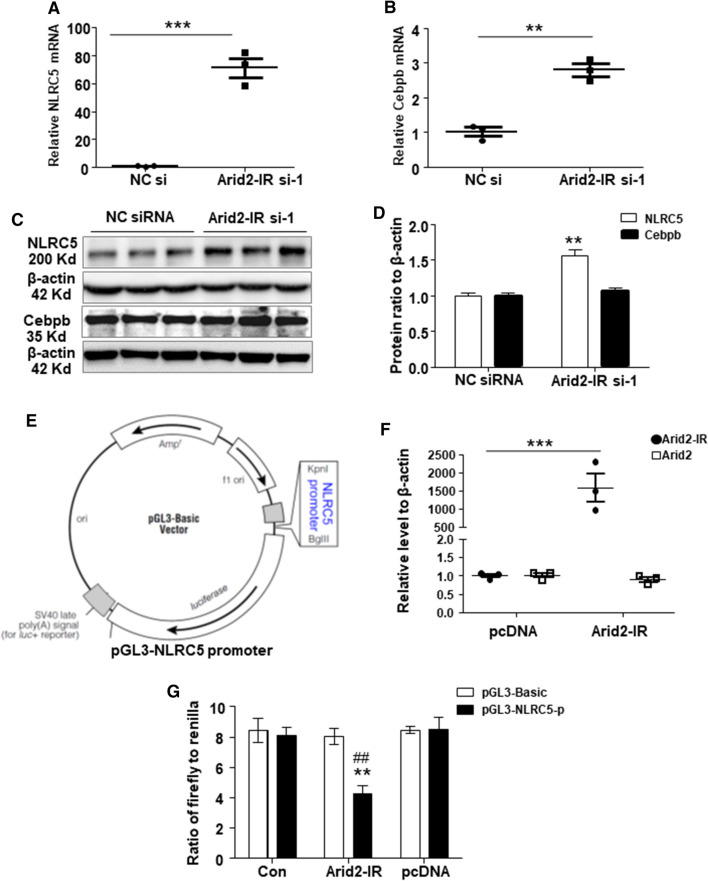
Fig. 3.
QPCR was used to detect the relative level of NLRC5 (a) and Cebpb (b) in Arid2-IR siRNA-1 or NC siRNA-transfected mTECs. c Protein level of NLRC5 and Cebpb in Arid2-IR siRNA-1 or NC siRNA-transfected mTECs analyzed by Western blot analysis. d Graphic presentation of relative abundance of NLRC5 and Cebpb normalized to β-actin in Arid2-IR siRNA-1 or NC siRNA-transfected mTECs. **p < 0.01, ***p < 0.001 versus NC siRNA. e Schematic representation of the luciferase reporter constructs. Two kilobase-length of NLRC5 promoter region inserted in the 5′end of luciferase reporter gene at KpnI/BglII site in pGL3-basic vector. (F) Relative level of Arid2-IR and Arid2 in Arid2-IR overexpression vector (Arid2-IR) or pcDNA3.1 empty vector (pcDNA) transfected 293 T cells was analyzed by qPCR. ***p < 0.001 Arid2-IR versus pcDNA group. g Dual luciferase assay was performed to detect the luciferase activity of pGL3-NLRC5-promoter compared to pcDNA3.1 empty vector in 293 T cells. pGL3-NLRC5-p: pGL3-NLRC5 promoter; pGL3-Basic: empty vector. Data were shown as the relative luciferase activity of firefly to renilla. **p < 0.01 versus pcDNA, ##p < 0.01 versus pGL3-Bacic. All data are mean ± SEM of at least three independent experiments

