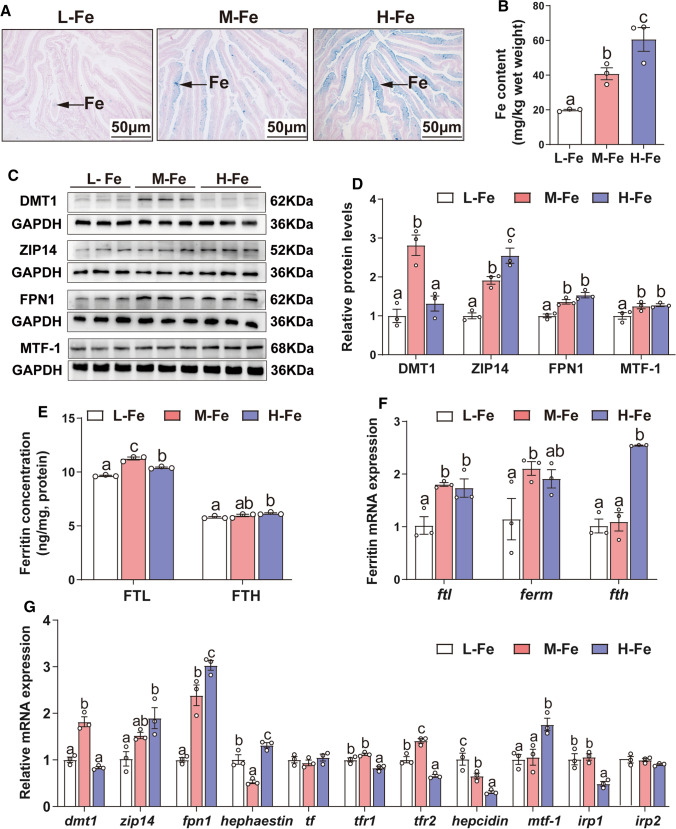
Fig. 1.
Effects of dietary Fe levels on Fe metabolism in the intestine tissues of yellow catfish. A Prussian blue staining. B Fe content. C, D Protein expression of Fe transport-related genes (DMT1, ZIP14, FPN1 and MTF-1). E The ferritin concentration. F The relative mRNA expression of Ferritin (ftl, ferm and fth). G The relative mRNA expression of genes related to Fe metabolism. Values are shown as means ± SEM (n = 3). Bars that share different letters within the same gene indicate significant differences among the three groups (P < 0.05)

