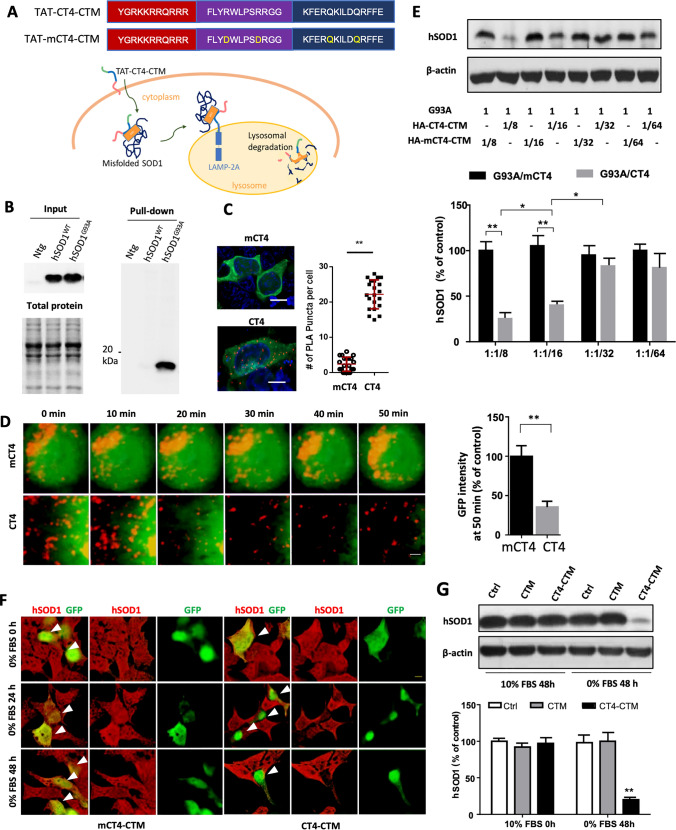
Fig. 1.
CT4-directed CMA system for degradation of misfolded SOD1. a Amino acid sequences of the CT4-directed CMA system. The system consists of three motifs: TAT, CT4, and CTM. It is designed to penetrate the plasma membrane, bind with misfolded SOD1, and destinate to lysosome for proteolysis. mCT4, 2Rs were changed into 2Ls within the CT4 epitope as control. b Affinity binding assay showed that the GST-tagged CT4 epitope of Derlin-1 pulled down misfolded SOD1 from the G93A-hSOD1 but not the WT-hSOD1 and non-transgenic mice. Input contained total human SOD1 in each spinal cord lysate. Each lane was loaded with 10 μg of protein. n = 4. c Co-localization of G93A with LAMP2. CHO cells expressing the GFP-tagged G93A-hSOD1 were treated with 20 µM CT4 peptide or mCT4 for 3 h, followed by proximity ligation assay (PLA) using anti-GFP and anti-LAMP2 primary antibodies. Red spots indicated interactions between GFP and LAMP2. n = 21 cells from 3 experiments. The scale bar represents 5 µm. d Live cell imaging on lysosomal degradation of misfolded SOD1. After bath application of CT4 or mCT4 (20 µM) to CHO cells expressing GFP-tagged G93A-hSOD1, the GFP and LysoTracker Red were recorded at intervals of 30 s for 50 min. n = 18 cells from 3 transfections. The scale bar represents 0.2 µm. e Levels of hSOD1 in CHO cells 48 h after double transfection with various plasmid ratios of G93A-hSOD1 to HA-CT4-CTM or HA-mCT4-CTM. The membranes were re-probed for β-actin to serve as loading controls. The intensities of the hSOD1 bands were normalized to means of G93A/mCT4 at 1:1/8. n = 9 from 3 independent experiments. Data were analysed with one-way ANOVA followed by Bonferroni’s multiple comparison post-test. **P < 0.001 *P < 0.005. Bars represent mean ± SD. f Representative immuno-florescence images of HEK 293T cells transfected with CT4-CTM or mCT4-CTM with serum deprivation for 0 h, 24 h, and 48 h, respectively. Arrows point to positively transfected cells. Scale bar: 10 μm. g Levels of hSOD1 in HEK 293T cells 0 h or 48 h after transient transfection with HA-CT4-CTM or HA-CTM. Shown are means ± SD of relative protein levels, normalized to means of the non-transfected; n = 9 from 3 separate cultures. Data were analysed with one-way ANOVA followed by Bonferroni’s multiple comparison post-test. **P < 0.01. Bars represent mean ± SD

