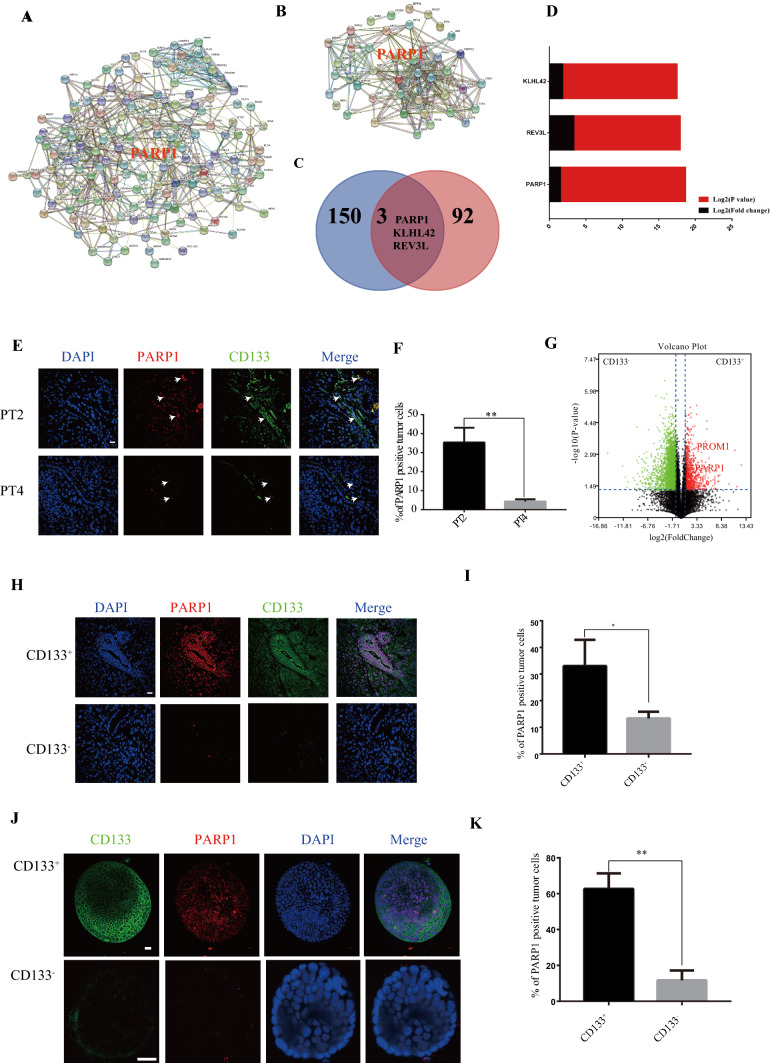
Fig. 2.
PARP1 is the central gene of CD133+ cells responsible for oxaliplatin resistance in gastric cancer. A Compared with PT3 and PT4 tumors, the protein interaction network diagram of STING database of mRNA differential expression in PT1 and PT2 tumors. The edges represent protein–protein associations. Cambridge Blue: from the curatorial database. Violet: measured experimentally. Green: The Jean community. Red: gene fusion. Blue: Co-occurrence of genes. Reseda: text mining. Black: Common expression. Clove: protein homology. B STING database CD133+ and CD133− tumor mRNA differentially expressed protein interaction network diagram. The edges represent protein–protein associations. Cambridge Blue: from the curatorial database. Violet: measured experimentally. Green: The Jean community. Red: gene fusion. Blue: co-occurrence of genes. Reseda: text mining. Black: common expression. Clove: protein homology. C There are 3 common core genes in (A) and (B), including PARP1, KLHL42 and REV3L. D Comparison of LOG2 (P value) and LOG2 (Fold change) of two gene sets in core genes of (C). E CD133 and PARP1 immunofluorescence staining of PT2 and PT4 tumor. Scale bar: 20 μm. F Proportion of PARP1+ cells in tumor in (E). G RNA-seq (n = 3) measures the fold change (y-axis, log2 transformation) and statistical significance (y-axis, log2 transformation) of gene expression (x-axis, log2 transformation) between CD133+ and CD133− cells populations. FC: fold change. Padj: adjust the p value for false discovery rate. The red dots represent the significantly differentially expressed genes of CD133− with padj < 0.05. Green dots indicate differentially expressed genes with CD133+ padj < 0.05. PROM1 (log2FC = 5.40, P = 0.0047), PARP1 (log2FC = 1.10, P = 0.000589). H Representative images of PARP1 and CD133 levels stained by immunofluorescence in CD133+ and CD133− tumors. The scale represents 20 μm. I Proportion of PARP1+ cells in tumor in (H). J Representative images of PARP1 and CD133 levels stained by immunofluorescence CD133+ and CD133− organoids. The scale represents 20 μm. K Proportion of PARP1 + cells in organoids in (J). *p < 0.05, **p < 0.01, ***p < 0.001

