Fig. 3.
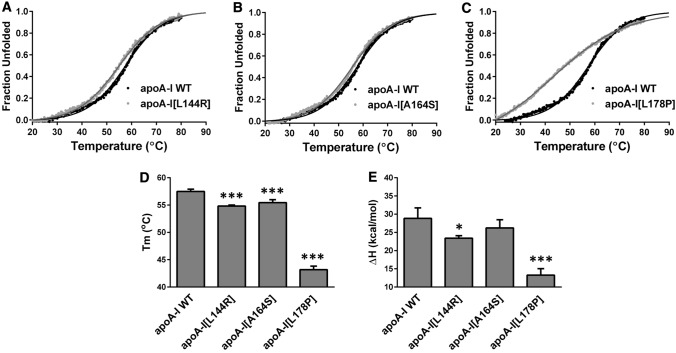
Effect of L144R, A164S and L178P mutations on thermal unfolding of apoA-I. a–c The thermal denaturation profile of each apoA-I mutant is presented in comparison to the WT protein. Solid line indicates the fit of data to Boltzmann sigmoidal model. The y axis has been normalized to correspond to the fraction of the protein in the unfolded state. For normalization, 0 is defined as the value of Boltzmann fit at 20 °C and 1 as the plateau value of Boltzmann fit. The fit is extrapolated to 90 °C to allow better visualization of the plateau. d, e Apparent Tm and ΔH values for the heating-induced transitions of WT and mutant apoA-I forms. Values represent the means ± SD (n = 3–4). *p < 0.05; ***p < 0.0001 versus apoA-I WT

