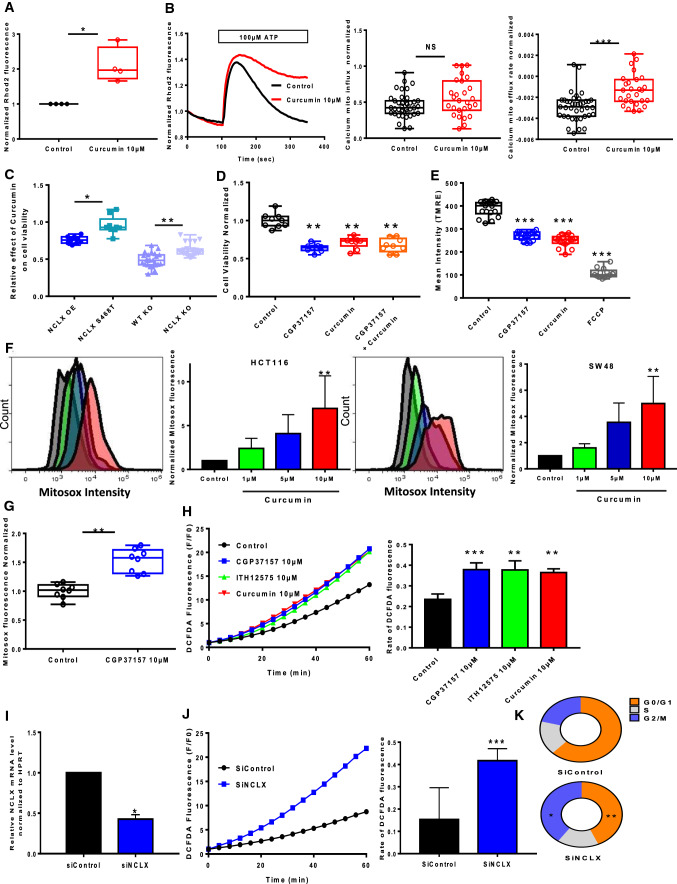
Fig. 2.
mtCa2+ efflux and ROS production are altered by treatment with curcumin and NCLX targeting in CRC cells. A Global mtCa2+ was evaluated with Rhod2 fluorescence in HCT116 cells treated or not with curcumin (n = 4 independent experiments; Mann–Whitney test, *P < 0.05). B mtCa2+ responses following ATP stimulation (100 μM) were measured in HCT116 cells treated or not with curcumin. The average mtCa2+ influx (peak) (left) and the rates of mtCa2+ efflux (right) are shown (n = 5 independent experiments with 27–39 measurements; Mann–Whitney test, ***P < 0.001). C The knockdown of either NCLX function (through the over-expression of the S486T mutant, described a dominant-negative) or expression significantly reduced the effect of curcumin on cell viability (n = 4 independent experiments of 9 measurements per group for overexpressed NCLX or NCLX S468T *P < 0.05, n = 5 independent experiments of 24 measurements per group for WT KO or NCLX KO cells, **P < 0.01). D CGP37157 and curcumin had no additive effect on cell viability (MTT assay). The results are expressed as the mean ± SD of 3–5 independent experiments (ANOVA followed by Tukey’s post hoc multiple comparisons, *P < 0.05, **P < 0.01). E Mitochondrial membrane potential using the dye TMRE in HCT116 cells treated with 10 μM CGP37157 or 10 μM curcumin or 50 µM FCCP (n = 6, Mann–Whitney test, ***P < 0.01). F HCT116 and SW48 cells were pre-treated with curcumin (1, 5 or 10 μM) for 2 h. The cells were stained with MitoSOX for 40 min. The bar graph presents a quantitative analysis of mtROS. The data represent the mean ± SD (n = 4 independent experiments, **P < 0.01, ANOVA followed by Tukey’s post hoc multiple comparisons). G Effect of CGP37157 pre-treatment on the mtROS level in HCT116. The data are shown as the mean ± SEM of at least three separate experiment with eight measurements each (n = 8, Mann–Whitney test, **P < 0.01). H The effects of curcumin and NCLX blockers (CGP37157 or ITH12575) on cytosolic ROS responses in HCT116 cells were analyzed. DCFDA fluorescent traces are shown as the normalised (F/F0) mean. The histograms show the slope of cytosolic ROS production as a function of time (n = 5 independent experiments with 31–56 measurements per group **P < 0.01, ***P < 0.001; ANOVA followed by Tukey’s post hoc multiple comparisons). I RT-qPCR data showing SLC8B1 mRNA relative to HPRT in HCT116 cells transfected with siRNA against NCLX (n = 4 independent experiments, Mann–Whitney test, *p < 0.05). J Effect of siRNA-mediated NCLX inhibition on cytosolic ROS production evaluated in HCT116 (n = 4 independent experiments with 16–32 measurements per group, Mann–Whiney test, **P < 0.01). K Effect of siRNA against NCLX on cell cycle of HCT116. The results are representative of five independent experiments n = 5 independent experiments; ANOVA followed by Tukey’ post hoc multiple comparisons, **P < 0.01 and ***P < 0.001)

