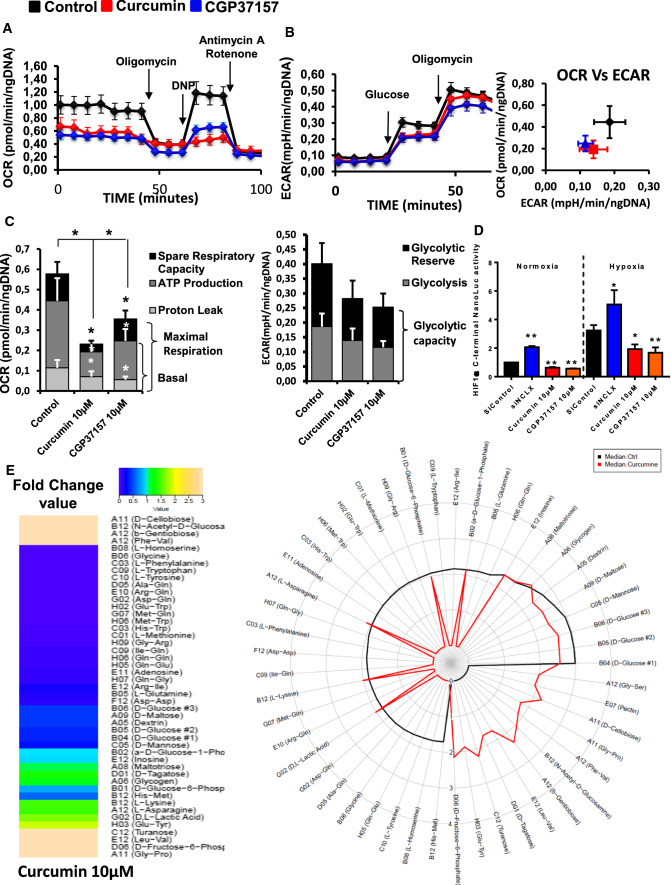
Fig. 4.
Targeting NCLX-dependent signaling elicits rapid and dynamic changes in CRC cell metabolism. A Energy metabolism in HCT116 cells pre-treated with curcumin and NCLX blocker (CGP37157). After four measurements of baseline OCR, glucose, oligomycin, DNP, and the mixture of antimycin A and rotenone were injected sequentially, with measurements of OCR recorded after each injection. ATP-linked OCR and OCR due to proton leak can be calculated using basal and oligomycin-sensitive rates. Injection of DNP is used to determine the maximal respiratory capacity. Injection of antimycin A and rotenone allows for the measurement of OCR independent of complex IV. B Cellular aerobic glycolysis was evaluated by measures of the ECAR from HCT116 cells treated with curcumin or CGP37157 (10 µM) following sequential injection (arrow) of glucose (10 mM) and then oligomycin (1 μmol/L) (n = 5 independent experiments; Mann–Whitney test, ***P < 0.001). C The spare respiratory capacity (mitochondrial reserve capacity) was calculated by subtracting the basal from the maximal respiration. The bio-energetic profiles of HCT116 with or without 10 µM curcumin or 10 µM CGP37157 were measured using sequential injection of glucose, oligomycin (1 μmol/L), DNP (100 μmol/L) and the mixture of antimycin A (0.5 μmol/L) and rotenone (0.5 μmol/L). The mitochondrial reserve capacity of untreated control and curcumin- or CGP37157-treated HCT116 cells are shown. The results are presented as the mean ± SD of 5 independent experiments of 3–5 measurements (Mann–Whitney test, *P < 0.05, ***P < 0.001). D HCT116 HIF1α-C-terminal Luc cells incubated under normoxic or hypoxic conditions for 48 h. Four hours before the end of incubation, the cells were treated with CGP37157 or curcumin. The values represent the mean ± SD of 3–6 independent experiments (ANOVA followed by Tukey’s post hoc multiple comparisons, *P < 0.05 **P < 0.01). E The effect of curcumin on the ability of HCT116 cells to metabolise 367 substrates was measured using the OmniLog® Analyzer. The heatmap shows the AUC fold-change data induced by curcumin treatment. The radial plot shows the AUC of metabolized substrates (49 substrates with positives kinetic curves with AUC > 50 in at least one condition) on a logarithmic scale

