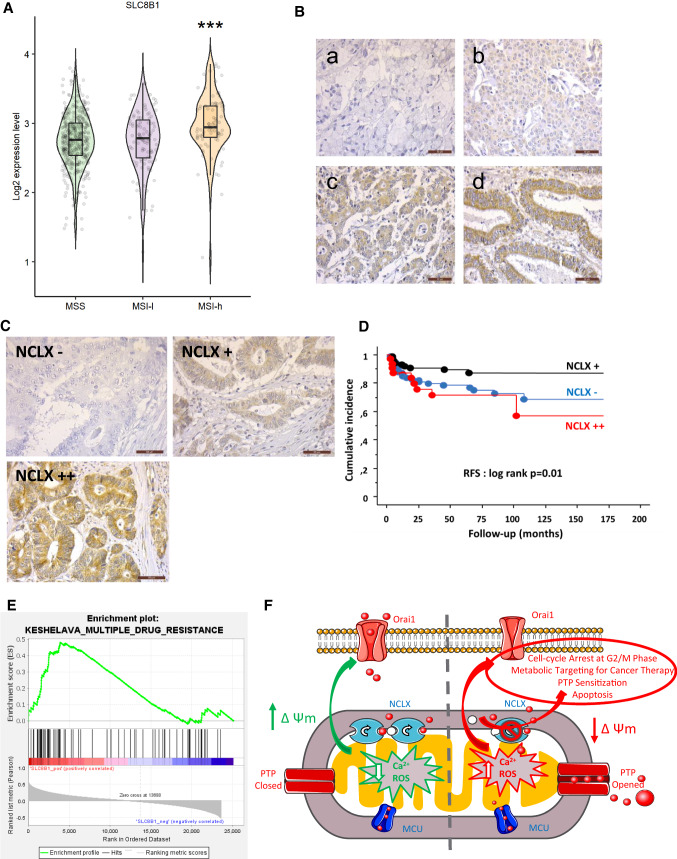
Fig. 7.
NCLX expression and clinical parameters of a cohort of patients with MSI CRC. A Boxplots showing the mRNA expression profile of NCLX in primary CRC tissues from the TCGA dataset according to their MSI/MSS status (MSS, n = 423; MSI-Low [MSI-L], n = 100; MSI-High [MSI-H], n = 81). B/ Representative NCLX expression during the differentiation of the colonic epithelium (COLOMIN cohort). C Representative NCLX immunostainings of three groups of patients with CRC classified according to their NCLX expression level (COLOMIN cohort). D Kaplan–Meier plots (cumulative incidence in function of follow-up of patients with CRC) showing RFS of the COLOMIN cohort (P = 0.01 by the log-rank test). E GSEA of the KESHELAVA multiple drug resistance signature in primary MSI CRC tissues from the TCGA dataset. F Schematic diagram of the main findings of the study

