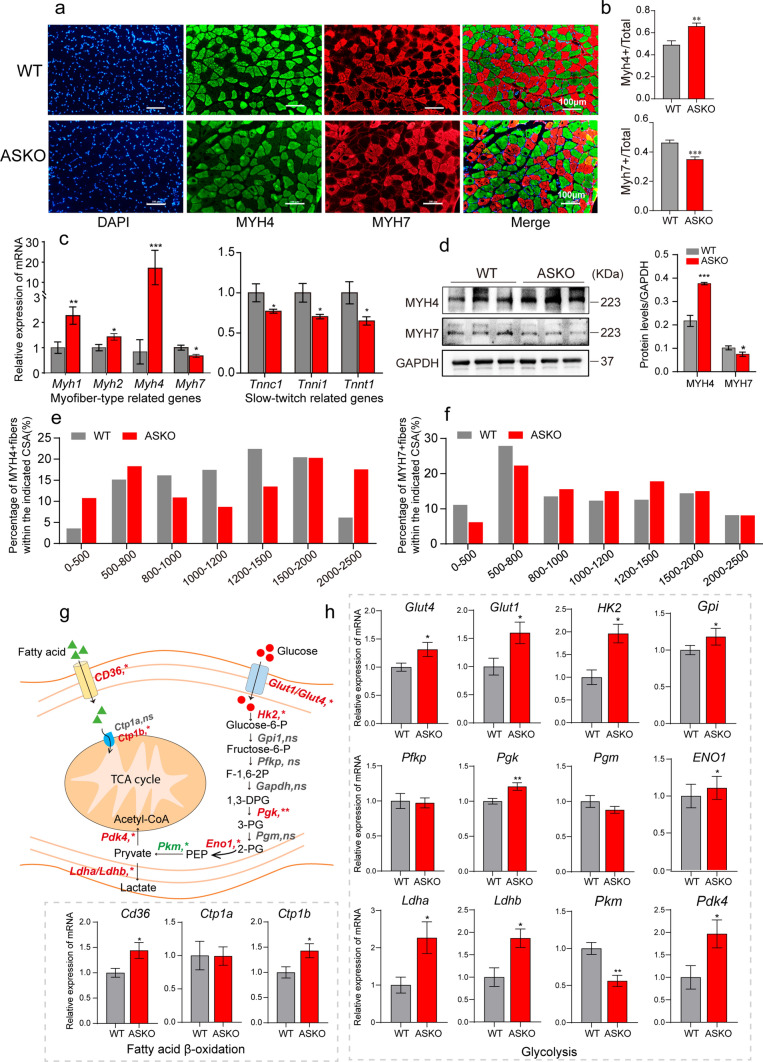
Fig. 2.
The fiber types of skeletal muscles are transformed in ASKO mice. a, b Representative images (a) and quantification (b) of MYH4 and MYH7 staining in the soleus muscle (n = 5 mice/group). Scale bar = 100 μm. Blue: DAPI; Green: MYH4; Red: MYH7. c The expression levels of fiber type-related genes (Myh1, Myh2, Myh4 and Myh7) and slow-twitch troponin related genes (Tnnc1, Tnni1 and Tnnt1) were detected by qPCR in the soleus muscle from 6-month-old mice (n = 6 mice/group). d Immunoblots (left panel) and quantification (right panel) of MYH4 and MYH7 in the soleus show the increased MYH4 but decreased MYH7. GAPDH was used as a loading control. e, f Comparison of the percentage of MYH4 + (e) and MYH7 + (f) fibers in the indicated cross-sectional area in soleus muscle of WT and ASKO mice. g Schematic diagram of the processes of fatty acid oxidation and glycolysis in the skeletal muscle. h The mRNA expression levels of genes in (g) were detected by qPCR in the soleus from WT and ASKO mice (n = 6 mice/group). Values are presented as the mean ± SEM. *P < 0.05, **P < 0.01, and ***P < 0.001

