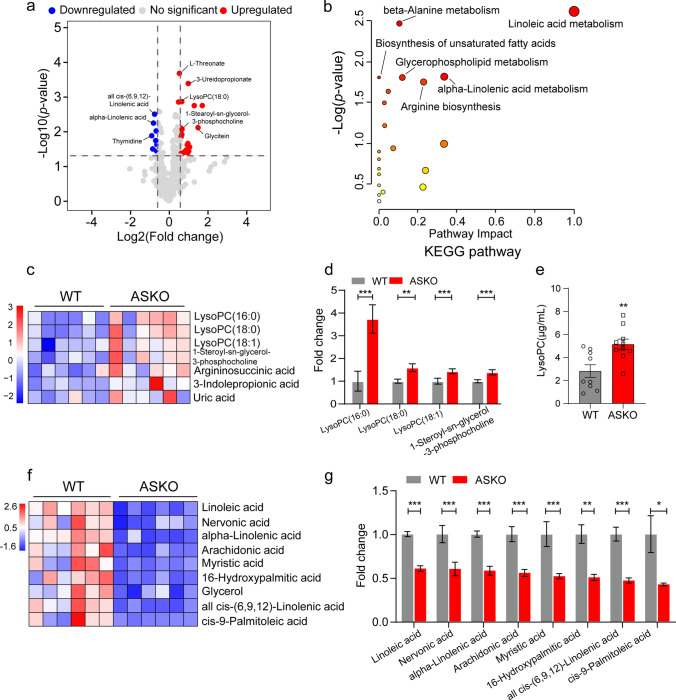
Fig. 3.
A significantly increased LysoPCs were found in serum of ASKO mice. a Volcano plots were built based on the P value and FC for overall metabolites, which were measured by metabolomics in serum of 6-month-old WT and ASKO mice (n = 6 mice/group). With the criteria of P < 0.05 and |FC|> 1.5, 21 metabolites (red dots) were significantly increased, and 19 metabolites (blue dots) were markedly decreased. Gray dots represent the no significant differences in metabolites. b KEGG pathway analysis of the differential metabolites in serum of the two groups of mice. c Heatmap indicating several upregulated LysoPCs in serum of ASKO mice. d The intensity of the upregulated LysoPCs in serum of WT and ASKO. e The concentration of serum LysoPC in two groups was detected by ELISA (n = 10 mice/group). f Heatmap indicating several downregulated PUFAs in serum of ASKO mice. g The intensity of downregulated PUFAs. Data are presented as the mean ± SEM. *P < 0.05, **P < 0.01, and ***P < 0.001

