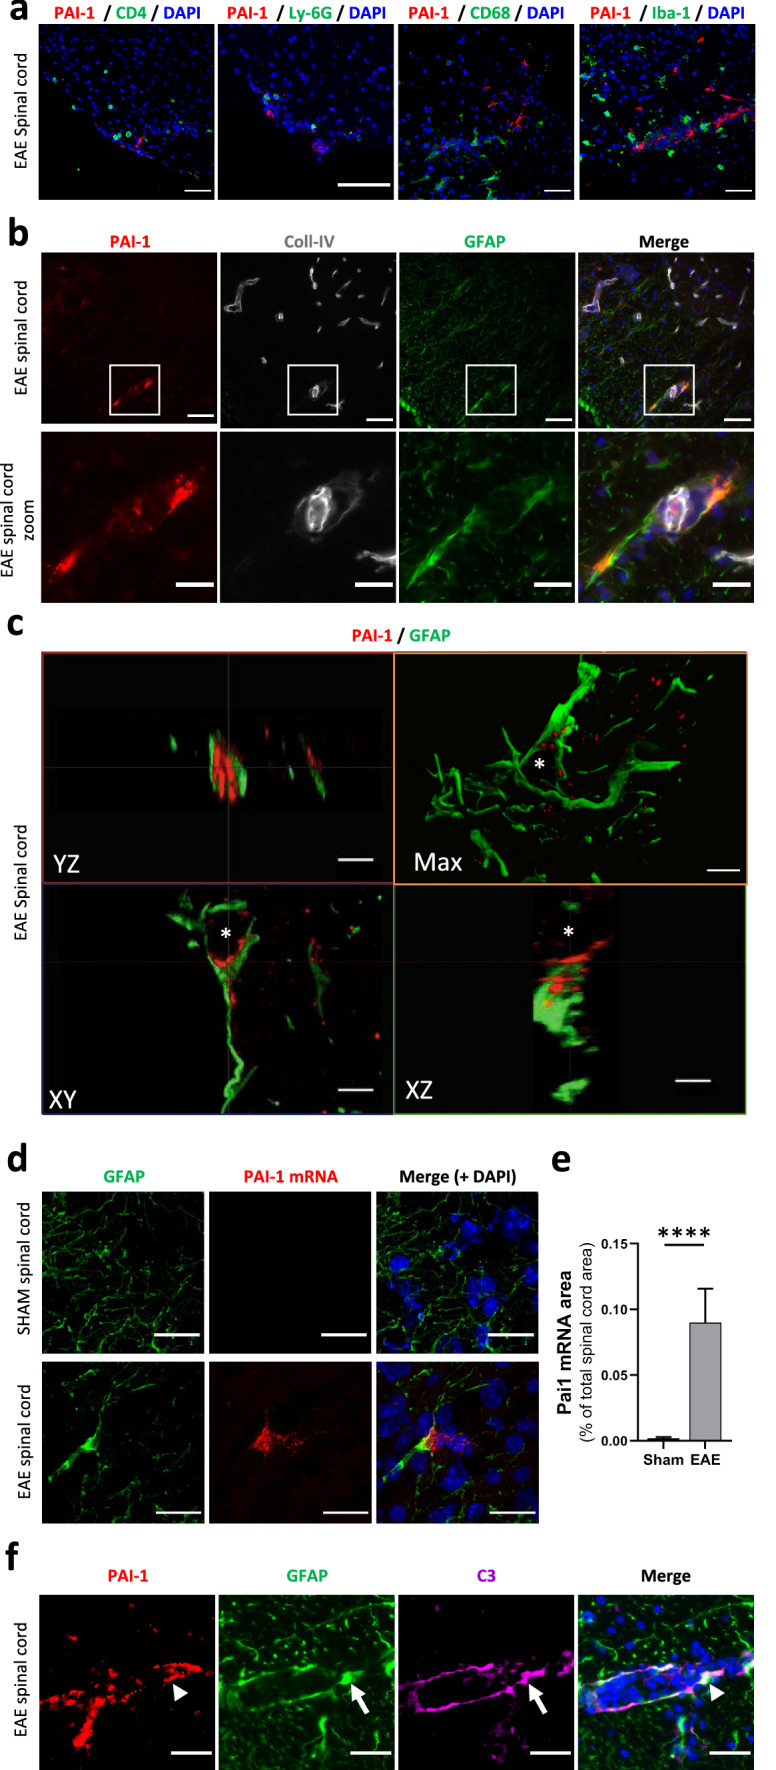
Fig. 3.

PAI-1 is expressed in activated astrocytes. a Representative immunostaining of PAI-1 (red) in combination with a set of inflammatory cell-type markers (green): T4 lymphocytes (CD4); neutrophils (Ly-6G); macrophages/microglia (CD68 and Iba-1) on the lumbar spinal cord from symptomatic EAE mice (DAPI: blue). b Representative immunostaining of PAI-1 (red), Coll-IV (blood vessels, grey) and GFAP (astrocytes, green) on the spinal cord from symptomatic EAE mice (DAPI: blue). c 3D reconstruction (by maximal intensity projection: max) and orthogonal sections of representative confocal imaging of PAI-1 (red) and GFAP (green) immunostaining on the lumbar spinal cord from symptomatic EAE mice (asterisk: nucleus). d, e Representative image of fluorescent in situ hybridization (d) of PAI-1 mRNA (red) and GFAP immunostaining (green) on the lumbar spinal cord from sham and symptomatic EAE mice (DAPI: blue) and its relative quantification (e) as percentage of the total spinal cord area n = 3. Data are represented as mean ± SEM and analyzed with a Mann–Whitney U test. ****p < 0.0001. f Representative immunostaining of PAI-1 (red, arrowhead), GFAP (green, arrow) and C3 (magenta, arrow) on the lumbar spinal cord from symptomatic EAE mice (DAPI: blue). Scale bars: 50 µm in a and upper b; 20 µm in lower b and d; 10 µm in c and f
