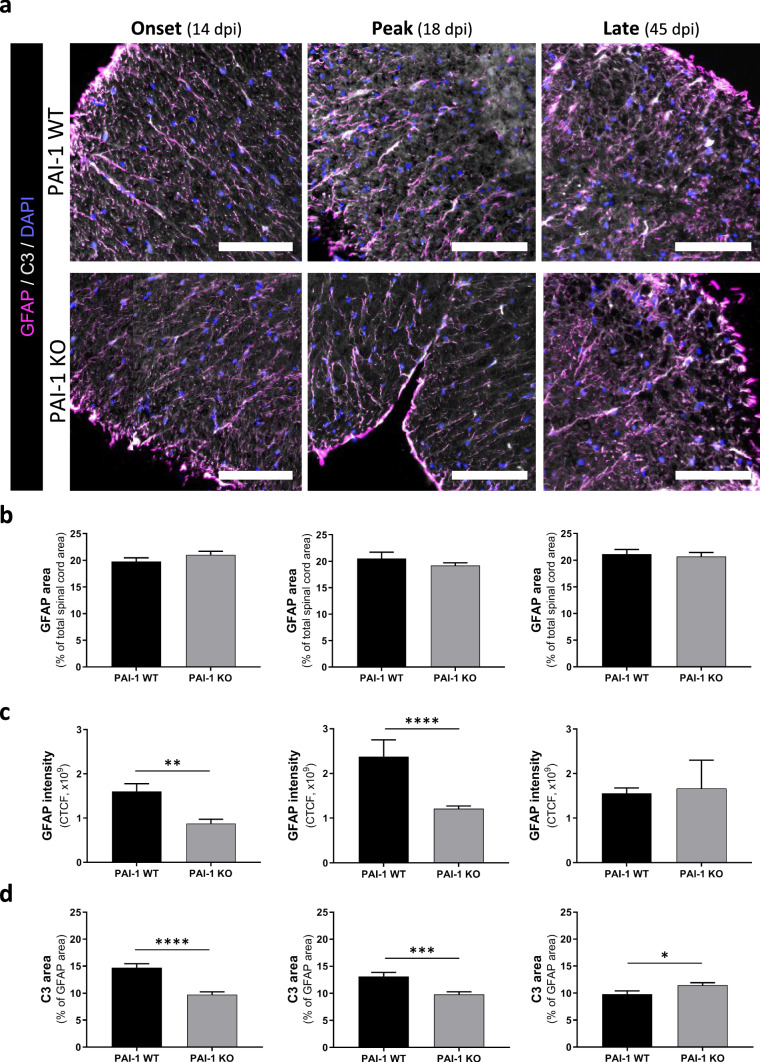
Fig. 6.
PAI-1 KO mice exhibit less reactive astrogliosis of MOG-induced EAE mice. a Representative immunostaining of GFAP (magenta) and C3 (grey) in the spinal cord from PAI-1 WT and PAI-1 KO mice at onset (14 dpi), peak (18 dpi) and late stages (45 dpi) during MOG-induced EAE (DAPI: blue). At 14, 18 and 45 dpi, the spinal cord region is, respectively, the low thoracic, lumbar and cervical area. b-d Corresponding quantifications of (b) GFAP area, (c) GFAP intensity and (d) C3 area in astrocytes (GFAP positive area). CTCF: corrected total cell fluorescence. Data are represented as mean ± SEM. n = 3 per condition Mann–Whitney U test; *p < 0.05; **p < 0.01, ***p < 0.001, and ****p < 0.0001. Scale bars: 40 µm

