Fig. 2.
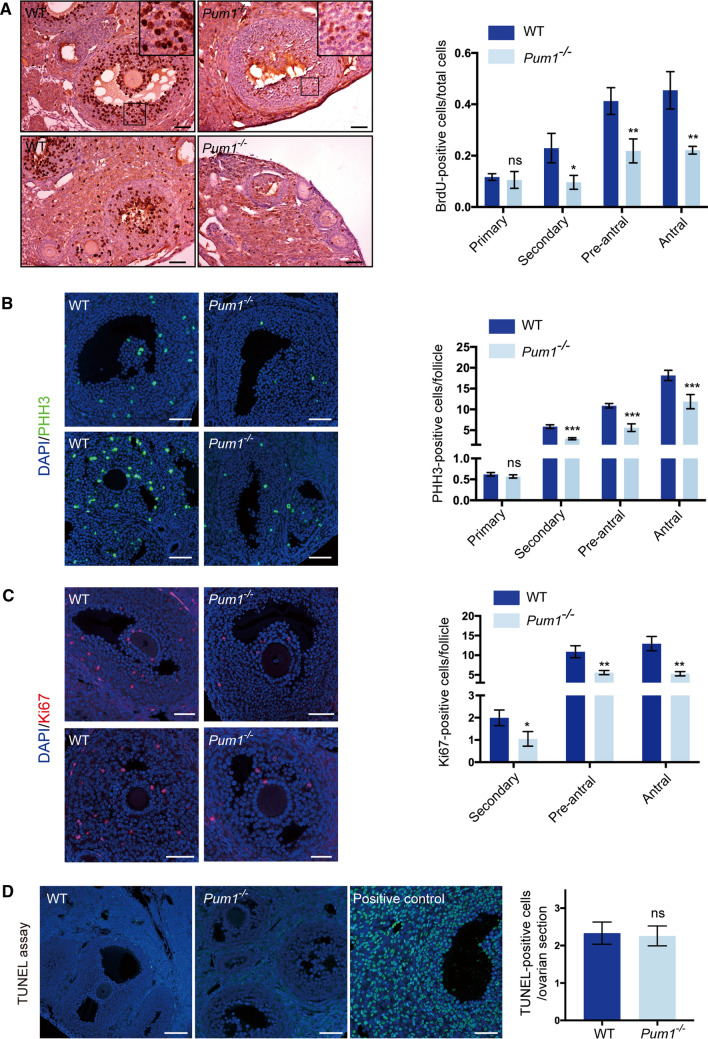
Granulosa cell proliferation was significantly reduced in Pum1-null ovaries. A Proliferation of follicular granulosa cells was assessed by BrdU labeling. Ovarian sections from 2-month-old wild type (WT; n = 3) and Pum1−/− (n = 3) mice are shown on the left. The scale bar is 50 μm for all images. Quantification of BrdU-positive cells in different stages of follicles between WT and mutant ovaries is shown in the graph. Data are the mean ± SEM of three mice. **P < 0.01; *P < 0.05. B Immunofluorescence staining for Phospho-H3 (PPH3) in the ovaries of WT and Pum1−/− mice. Quantification of PPH3-positive nuclei in the primary, secondary, pre-antral, and antral follicles of WT (n = 4) and Pum1−/− (n = 4) mice. ***P < 0.001; ns, not statistically significant. C Immunofluorescence analysis of Ki67 (red) and DAPI (blue) in adult WT and Pum1−/− ovarian sections and the merged images. Scale bars in all images are 50 μm. The number of Ki67-positive granulosa cells is significantly reduced in secondary and antral follicles of mutant ovaries. **P < 0.01, *P < 0.05. D Terminal deoxynucleotidyl transferase (TDT)-mediated dUTP-biotin nick-end labeling (TUNEL) staining assay showed apoptotic cells in WT (n = 3) and Pum1−/− (n = 3) ovaries marked by green staining. DAPI was used to visualize DNA (blue). Apoptotic cells induced with DNase I treatment were used as positive controls. Scale bar: 100 μm. The number of apoptotic cells was not significantly different between WT and Pum1−/− ovaries. Data are presented as mean ± SEM

