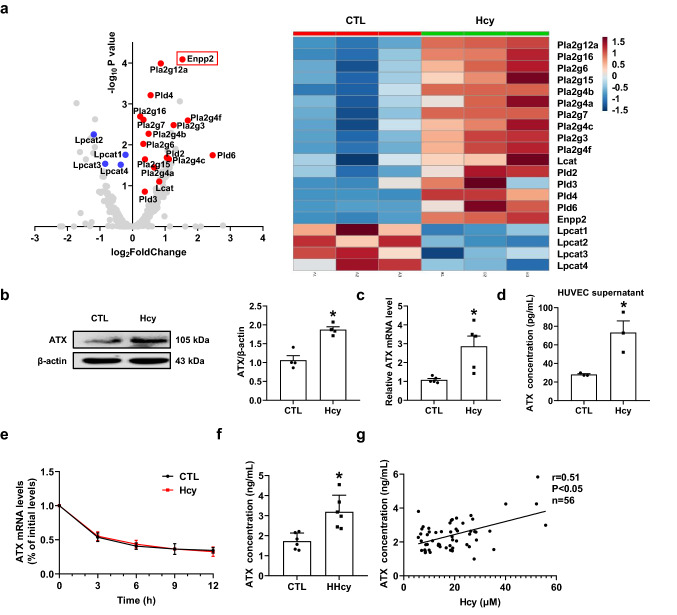
Fig. 3.
Hcy upregulates endothelial autotaxin (ATX) expression and secretion in vitro and in vivo. a Volcano plots and heat map showing differentially expressed metabolizing enzyme genes in metabolic pathways for LPC after Hcy (100 μM) stimulation for 24 h. b–d Human umbilical vein endothelial cells (HUVECs) were stimulated with or without Hcy (100 μM) for 24 h. b Representative Western blot analysis of ATX expression after Hcy stimulation for 24 h (n = 4). c Real-time polymerase chain reaction (PCR) quantification of ATX mRNA levels after Hcy stimulation for 24 h (n = 5). d ATX levels in the culture supernatants after Hcy stimulation for 24 h were measured via ELISA (n = 3). e Real-time PCR quantification of ATX mRNA levels of at 0 h, 3 h, 6 h, 9 h, 12 h after adding Hcy (100 μM) and actinomycin D (2 μg/mL) into the cell culture medium (n = 3). f Plasma ATX levels of control or HHcy C57BL/6J mice were measured via ELISA (n = 6). g Plasma ATX levels of patients were measured via ELISA (n = 56). Data shown are mean ± SEM. *P < 0.05, by unpaired Student t test (b–d, f)

