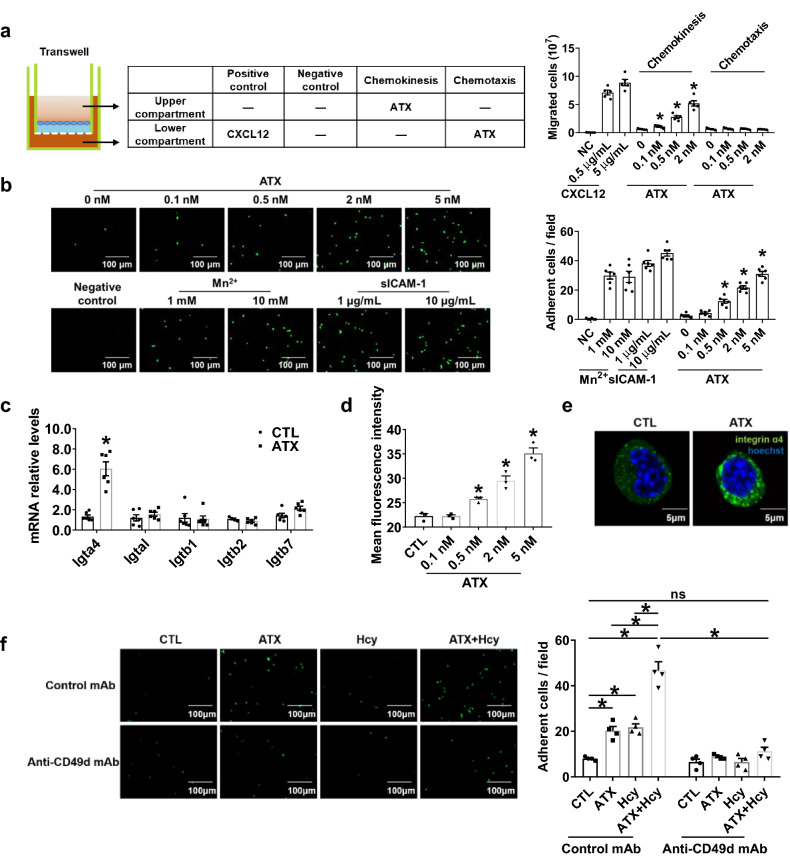
Fig. 5.
ATX induces chemokinesis and adhesion of T cells via activating integrin α4. a Transwell migration assay of Jurkat T cells added to the upper chamber with ATX added either to the same chamber (to induce chemokinesis) or to the lower chamber (to induce chemotaxis); after 3 h of incubation at 37 °C, cells that had migrated to the bottom chamber were quantified (n = 5). *P < 0.05, compared with 0 nM ATX. b Representative photographs and quantification of the adhesion of calcein-AM-labeled Jurkat T cells to HUVECs after coculture with or without indicated concentrations of ATX for 0.5 h (n = 6). Scale bar, 100 μm. *P < 0.05, compared with 0 nM ATX. c–e, g–j Splenic T cells purified from C57BL/6J mice were cultured in vitro with or without ATX for 0.5 h. c Real-time PCR quantification of mRNA levels of T cell integrin treated with ATX (0.5 nM) for 0.5 h (n = 6). d Quantification of activated integrin α4 in T cells after ATX stimulation for 0.5 h by flow cytometry (n = 3). e Representative immunofluorescent staining of integrin α4 after ATX (0.5 nM) stimulation for 0.5 h. Scale bar, 5 μm. f Representative photographs and quantification of the adhesion of calcein-AM-labeled Jurkat T cells to HUVECs after coculture for 0.5 h with or without ATX (0.5 nM) and Hcy (100 μM) and with an equal amount of mouse IgG or integrin α4 neutralizing antibody anti-CD49d mAb (10 μg/mL) (n = 4). Scale bar, 100 μm. Data shown are mean ± SEM. *P < 0.05, by one-way ANOVA followed by Tukey’s test for multiple comparisons (a, b, d), unpaired Student t test (c), or two-way ANOVA followed by Tukey’s test for multiple comparisons (f). ns no significance

